Quick Facts: Google Analytics Statistics in November 2026
- 20,171,372 websites use Google Analytics as of November 16, 2026. This is the live count on the Google Analytics technology page, rebuilt every day.
- Google Analytics runs on 6.19% of the 325.8 million websites webatla tracks, about one site in every 16.
- It is the most used tool in the Analytics category and the 18th most detected technology of the 3,083 webatla tracks.
- Among the 20 largest analytics tools, Google Analytics has a 66.5% market share of installs.
- It has 7.4 times as many sites as Cloudflare Browser Insights, 8.3 times as many as Facebook Pixel and 31 times as many as Microsoft Clarity.
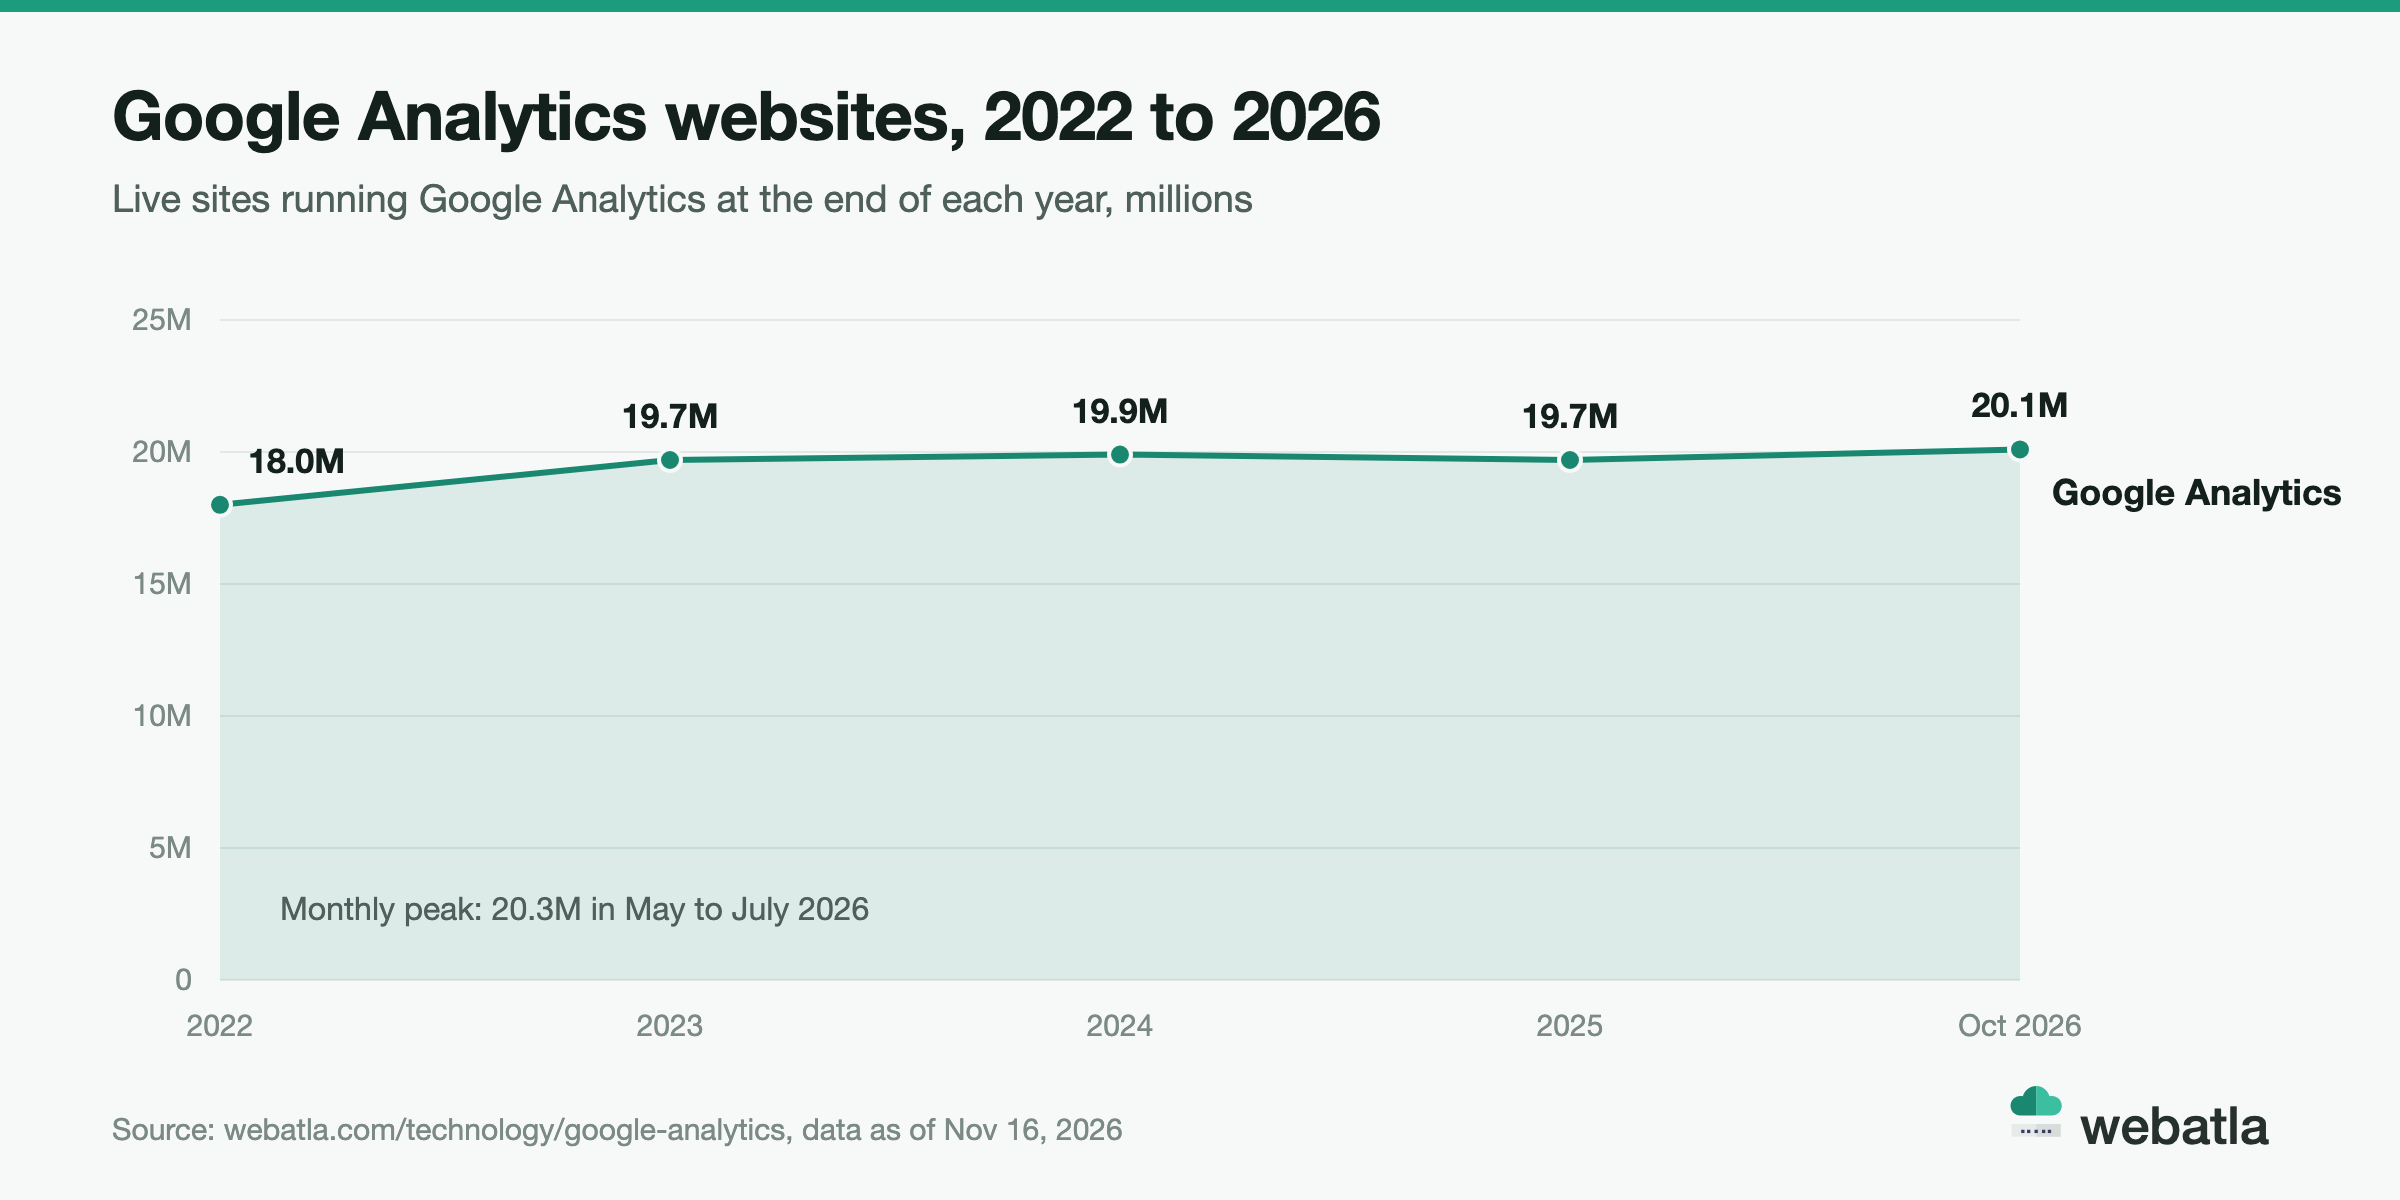
- The count has stayed close to 20 million since the end of 2023: 19.7M then, 19.9M in 2024, 19.7M in 2025 and 20.1M in October 2026.
- The count changed by +2.4% from October 2023 to October 2026 and +3% over the last 12 months.
- In the last 12 months 6.9 million sites came to Google Analytics and 6.32 million left.
- 3.36 million new sites started with Google Analytics in that year, about 9,200 a day.
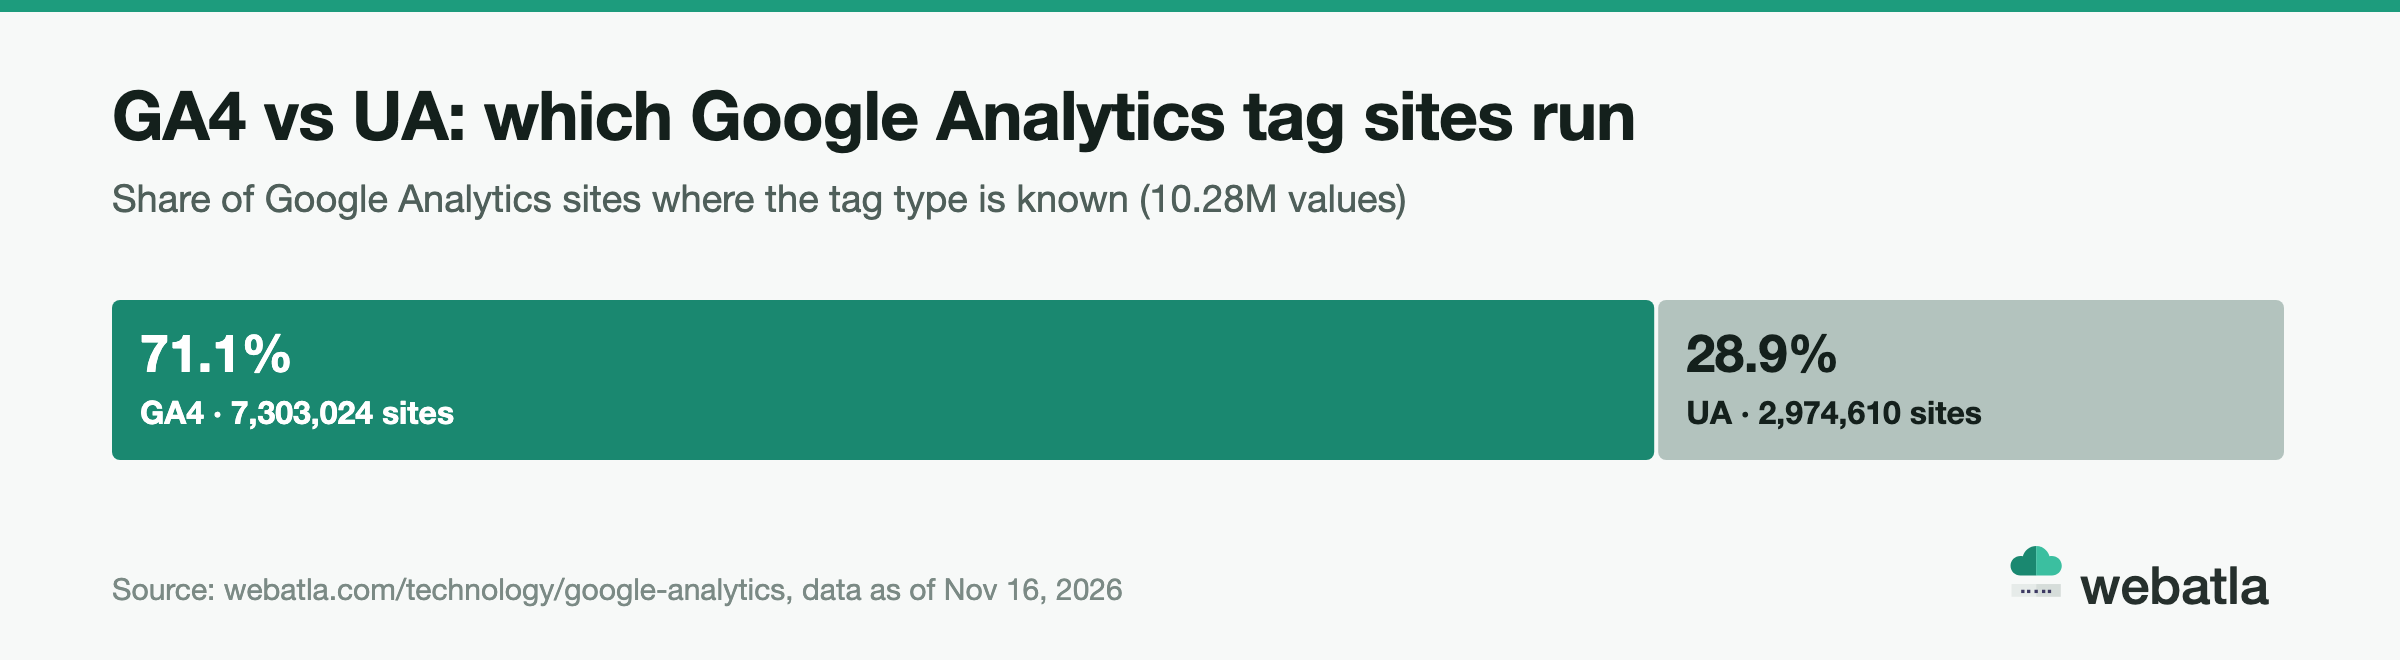
- 71.1% of sites with a known tag type run GA4 and 28.9% still carry the older UA tag.
- Google Tag Manager runs on 7,226,750 sites and Site Kit on 3,345,975, equal to 14.2% of the WordPress base.
- 51.3% of Google Analytics sites are hosted in the United States, and 45.1% sit on .com domains.
Every number in this article comes from the webatla index as of November 16, 2026. webatla scans 325.8 million websites, records the technology each one runs and publishes the result as daily files. Below you will find how many websites use Google Analytics, how its market share compares with Microsoft Clarity, Hotjar, Facebook Pixel, Yandex.Metrika, Plausible, Matomo and the rest, how the count moved since 2022, how far GA4 has replaced UA, and which companion tools, countries and domain extensions shape the Google Analytics web.
How many websites use Google Analytics in 2026?
Google Analytics runs on 20,171,372 websites as of November 16, 2026. That is every website where webatla detected Google Analytics in today's scan, counted one domain per site.
To get that number we look at every domain that answers with a web server, 325.8 million of them, and record the stack each one runs. An analytics tag is easy to see in a page, so Google Analytics is one of the clearest signals in the index.
To put 20.2 million in perspective:
- It is almost twice the installs of the next 19 analytics tools combined (10.18 million).
- It is 2.8 times the number of sites that run Google Tag Manager.
- It is one website in every 16 online.
What percentage of websites use Google Analytics?
6.19% of all websites run Google Analytics. The base here is the full web as webatla sees it: 325.8 million websites, including parked domains, placeholder pages, redirects and sites that run no analytics at all.
You may have seen much bigger percentages quoted elsewhere. Those figures usually come from a different base, most often the most visited sites only. Popular sites are far more likely to measure their traffic than the long tail of the web, so the share goes up.
webatla can show several views from the same data:
| Base | Websites or installs | Google Analytics share |
|---|---|---|
| All websites webatla tracks | 325,803,430 | 6.19% |
| Installs of the 20 largest analytics tools | 30,355,469 | 66.5% |
| Installs of the 15 largest analytics tools, ad pixels left out | 25,569,149 | 78.9% |
So the honest answer depends on the question. Out of every website online, about 1 in 16 runs Google Analytics. Out of every analytics tag webatla finds among the largest tools, two in three are Google Analytics. Leave out the ad pixels and conversion tags, and it is almost four in five.
Google Analytics market share vs other analytics tools
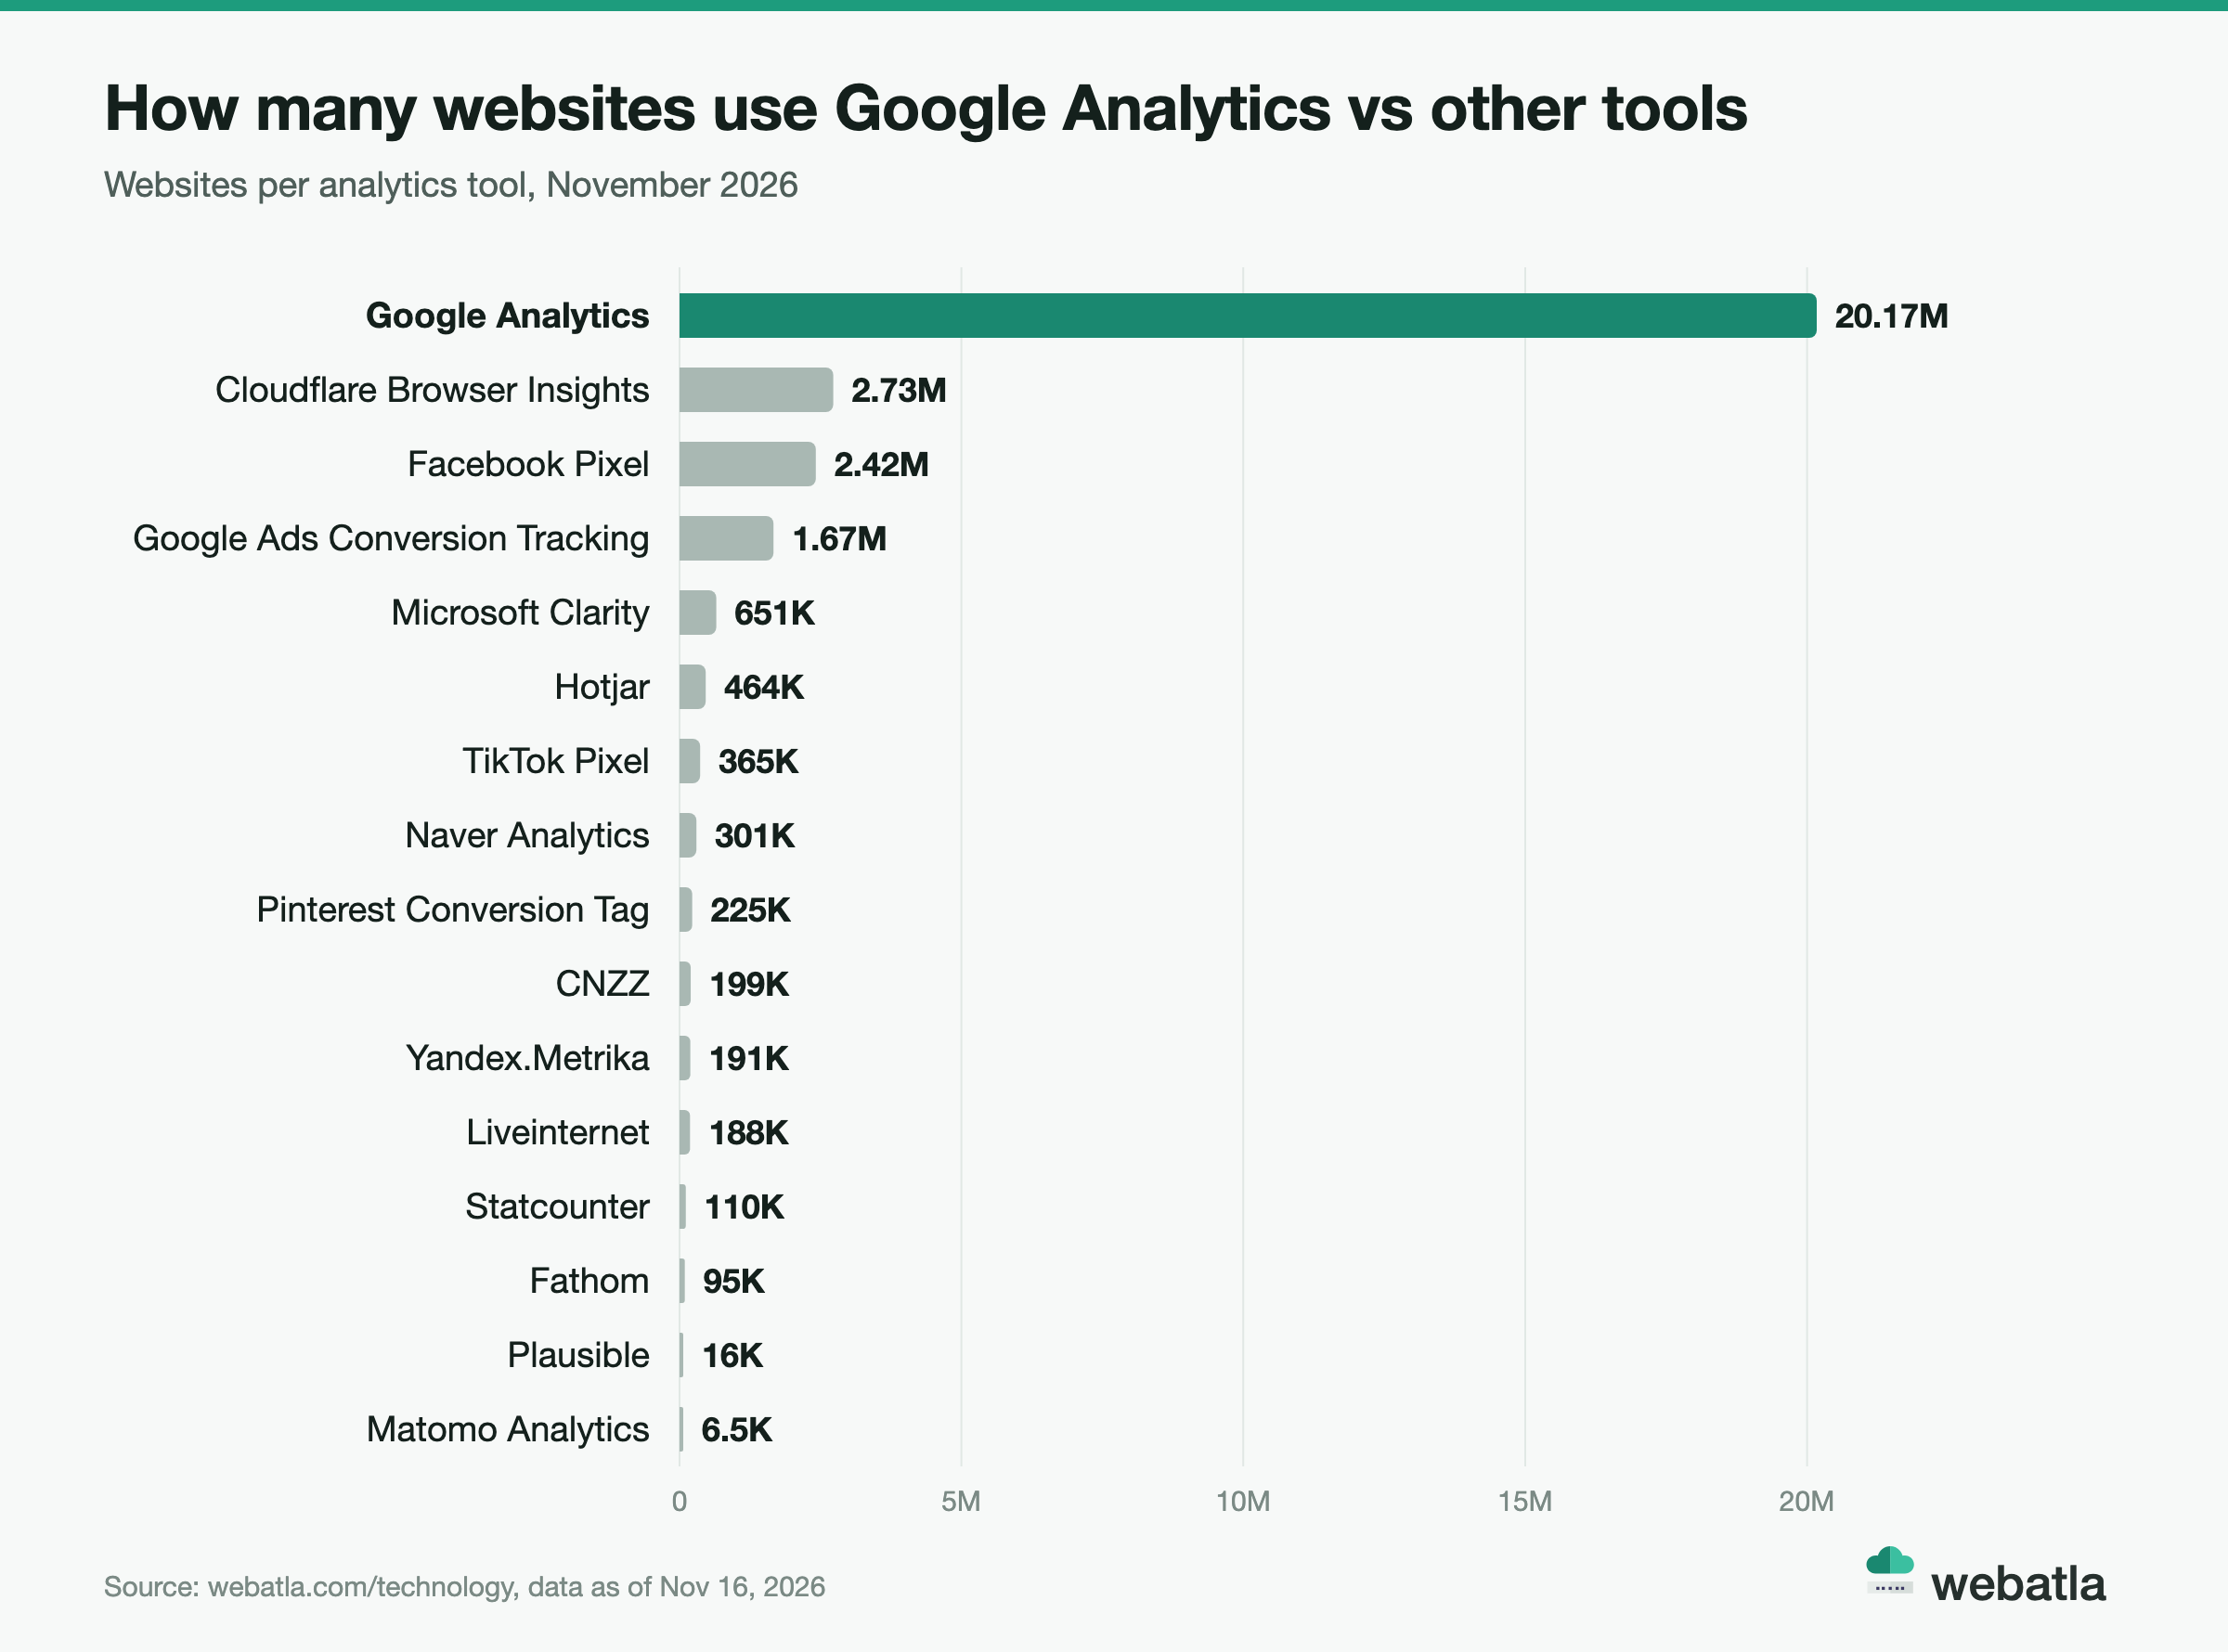
No other analytics tool comes close. Cloudflare Browser Insights is second with 2.73 million websites, Facebook Pixel third with 2.42 million and Google Ads Conversion Tracking fourth with 1.67 million. After that the numbers drop fast: Microsoft Clarity has 650,919 sites and every other tool in the group has fewer than 500,000.
| Analytics tool | Websites | Share of all websites | Share of top 20 installs | Google Analytics has |
|---|---|---|---|---|
| Google Analytics | 20,171,372 | 6.19% | 66.5% | |
| Cloudflare Browser Insights | 2,728,107 | 0.84% | 9.0% | 7.4x more |
| Facebook Pixel | 2,418,694 | 0.74% | 8.0% | 8.3x more |
| Google Ads Conversion Tracking | 1,666,062 | 0.51% | 5.5% | 12x more |
| Microsoft Clarity | 650,919 | 0.20% | 2.1% | 31x more |
| Hotjar | 463,916 | 0.14% | 1.5% | 43x more |
| TikTok Pixel | 364,726 | 0.11% | 1.2% | 55x more |
| Naver Analytics | 301,016 | 0.09% | 1.0% | 67x more |
| CNZZ | 199,013 | 0.06% | 0.7% | 101x more |
| Yandex.Metrika | 191,413 | 0.06% | 0.6% | 105x more |
| Liveinternet | 187,500 | 0.06% | 0.6% | 108x more |
| Statcounter | 110,237 | 0.03% | 0.4% | 183x more |
| PostHog | 110,102 | 0.03% | 0.4% | 183x more |
| Fathom | 94,735 | 0.03% | 0.3% | 213x more |
| Plausible | 16,475 | 0.01% | outside top 20 | 1,224x more |
| Matomo Analytics | 6,542 | under 0.01% | outside top 20 | 3,083x more |
The second chart shows the same market as one bar. We took the 20 largest tools in the Analytics category on the technology list, which together have 30.4 million installs, and split them by tool. A site can run several tools at once, so the base counts installs. We left out the WordPress plugins that only add another tool's tag (Site Kit, MonsterInsights and PixelYourSite), because counting them would count many Google Analytics sites twice.
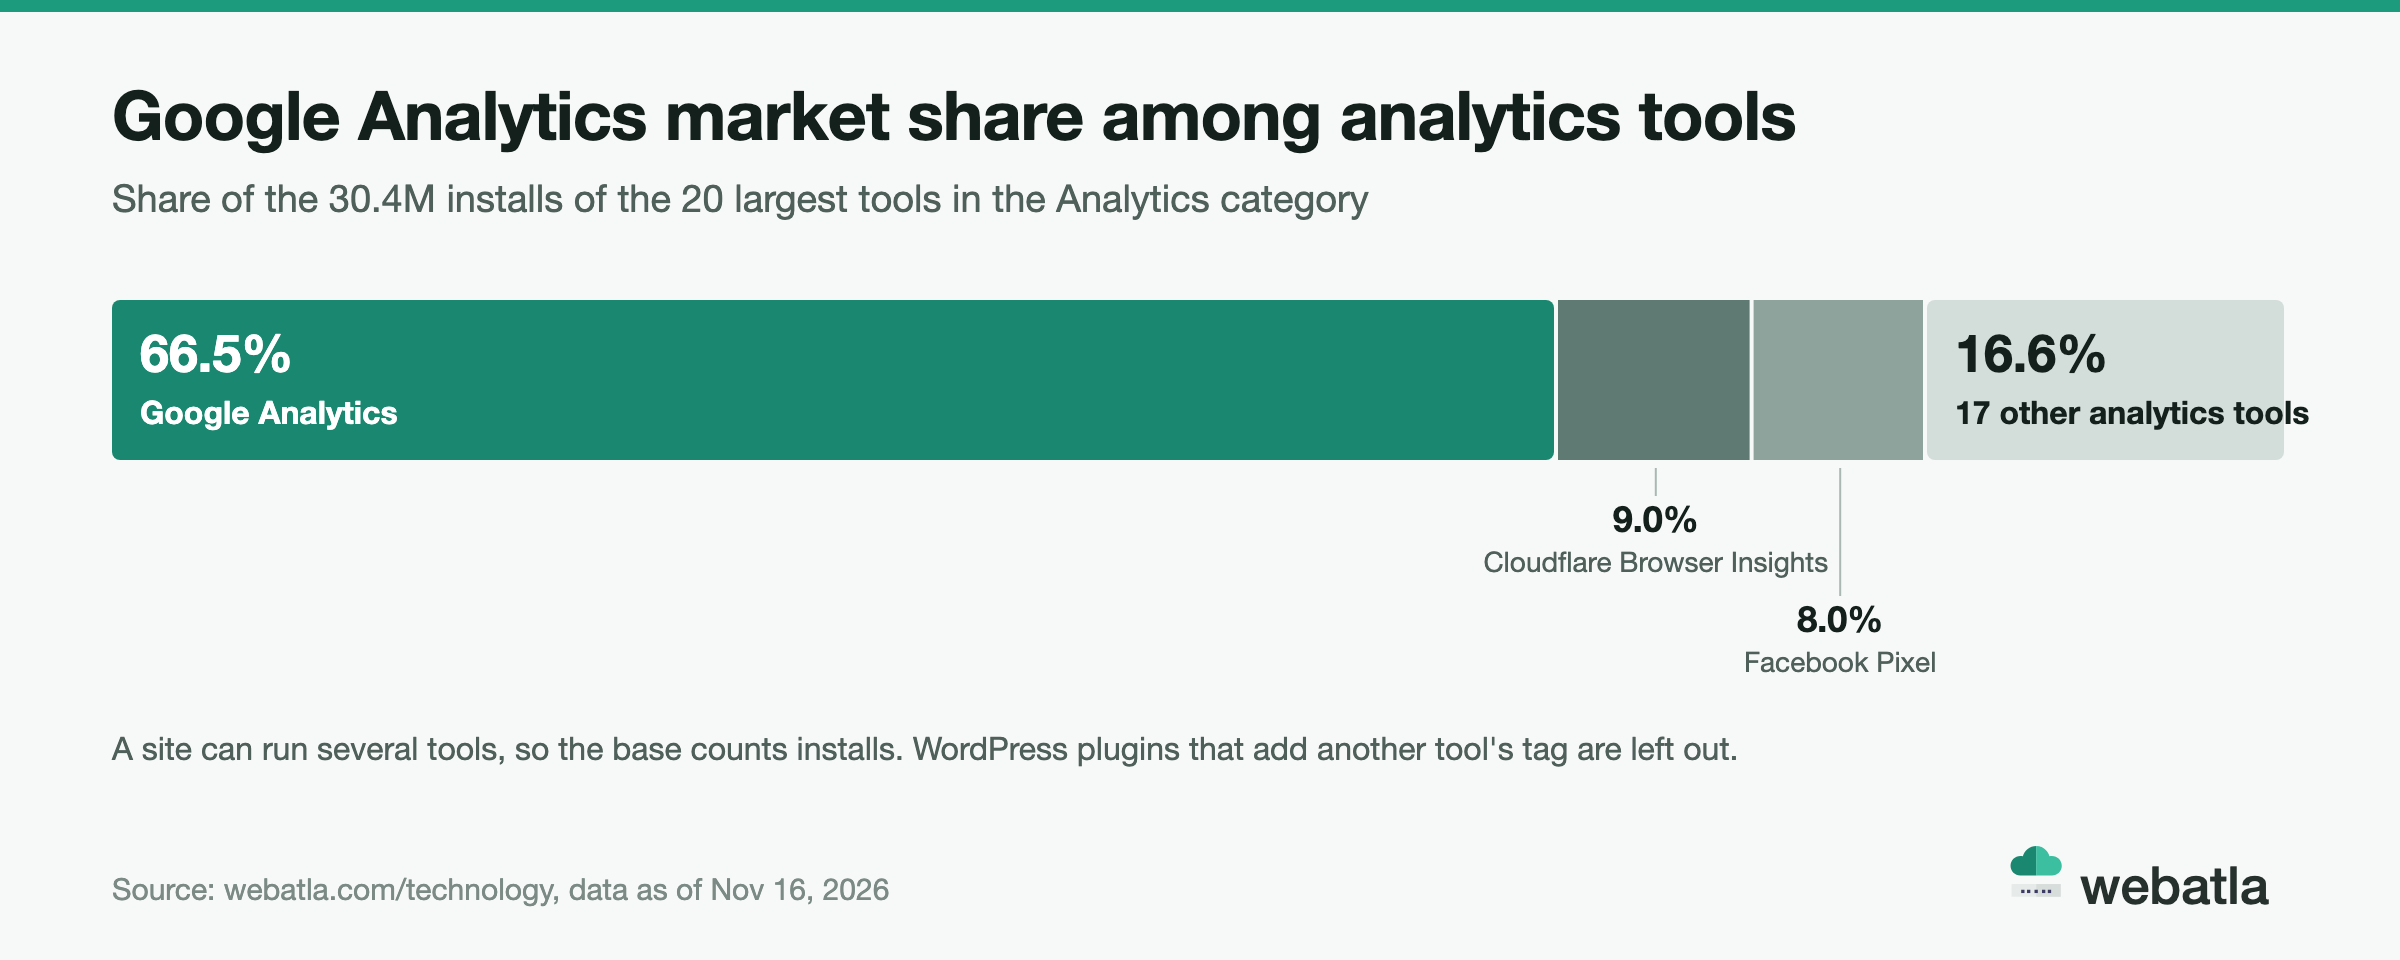
Four things stand out in the market share data.
Google Analytics has almost twice the installs of the other 19 tools combined. The rest of the group adds up to 10.18 million installs. Google Analytics alone has 20.17 million.
Most of the next tools do a different job. Cloudflare Browser Insights is switched on in the Cloudflare dashboard and injected at the network edge, with no change to the site's code. Facebook Pixel, Google Ads Conversion Tracking, TikTok Pixel and Pinterest Conversion Tag track ad campaigns. They are better read as companions of Google Analytics than as rivals.
Behavior analytics is a separate, smaller layer. Microsoft Clarity (650,919 sites) and Hotjar (463,916) record heatmaps and session replays. Together they have 1.11 million installs, about 5.5% of the Google Analytics count.
Privacy-first tools are still a niche. Fathom runs on 94,735 sites, Plausible on 16,475 and Matomo Analytics on 6,542. Fathom is the largest of the three and grew 37% in three years, but all three together have about 0.6% of the Google Analytics count.
Google Analytics growth statistics: 2022 to 2026
The Google Analytics count has stayed close to 20 million since the end of 2023. The webatla history shows 18.0 million sites at the end of 2022, 19.7 million at the end of 2023, 19.9 million in 2024, 19.7 million in 2025 and 20.1 million in October 2026.
| Year | Google Analytics sites at year end | Came in | Left | Net change |
|---|---|---|---|---|
| 2022 | 18.0M | 5.79M | 3.93M | +1.86M |
| 2023 | 19.7M | 6.87M | 5.21M | +1.66M |
| 2024 | 19.9M | 6.11M | 5.92M | +188K |
| 2025 | 19.7M | 6.62M | 6.78M | -163K |
| 2026, January to October | 20.1M | 5.65M | 5.28M | +378K |
Why the series starts in 2022. webatla measures the history from archived page code, and in that code only the current Google tag is recognized. Older snippets are not, so the years before 2022 count fewer sites than really used Google Analytics. We leave those years out.
The model shows net gains of 1.86 million in 2022 and 1.66 million in 2023. Then the line goes flat: +188,000 in 2024, -163,000 in 2025 and +378,000 from January to October 2026.
The monthly peak so far was 20.3 million sites from May to July 2026. By October the count was 20.1 million.
The "Left" column matters as much as the total. Sites leaving Google Analytics rose from 3.93 million in 2022 to 6.78 million in 2025. New arrivals keep pace, but the sites inside the list keep changing.
Is Google Analytics growing or declining?
Google Analytics is growing slowly. It changed by +2.4% from October 2023 to October 2026 and by +3% over the last 12 months. That is slow growth for a tool this large, with a lot of movement underneath.
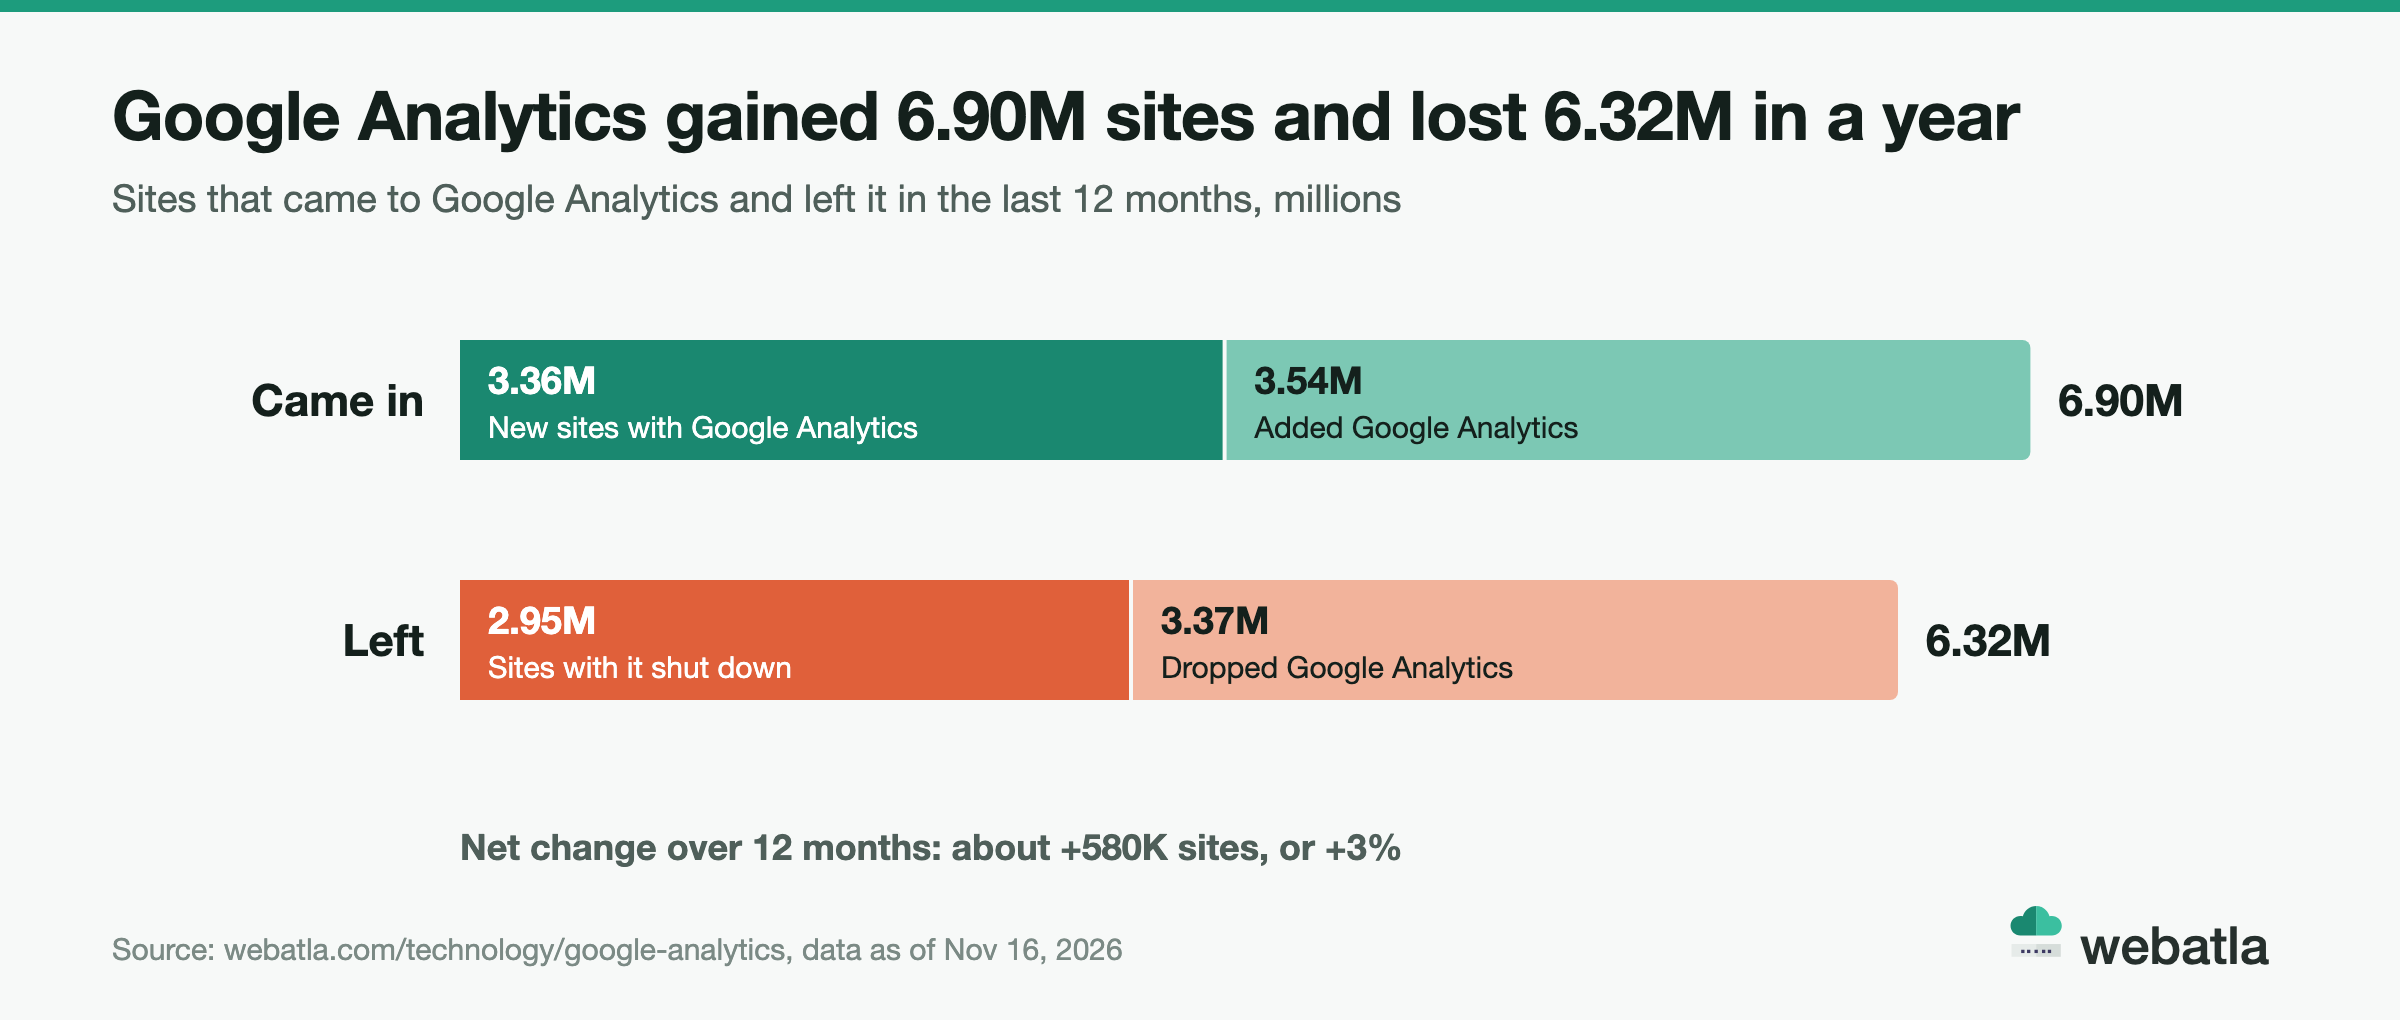
Over the last 12 months:
- 3.36 million new sites started with Google Analytics. These are fresh websites that launched with it, about 9,200 a day.
- 3.54 million existing sites switched to Google Analytics, adding the tag to a site that was already online.
- 2.95 million Google Analytics sites shut down. The domain expired or the site went offline.
- 3.37 million sites dropped Google Analytics while staying online.
Put these together and you see two contests, and Google Analytics wins both.
It wins new websites. 3.36 million new sites against 2.95 million closed ones gives Google Analytics about 410,000 extra sites a year from new launches alone.
It wins on switching, by a small margin. For every 100 sites that added Google Analytics, 95 removed it. That still leaves about 170,000 extra sites a year.
The churn is the bigger story. 6.32 million sites left in a year, almost a third of the 19.5 million base of October 2025. A list of Google Analytics sites from a year ago is badly out of date today.
Google Analytics has a seasonal pattern
The monthly data shows something you will not see in yearly totals. Google Analytics gains sites in winter and spring and loses them from summer into autumn.
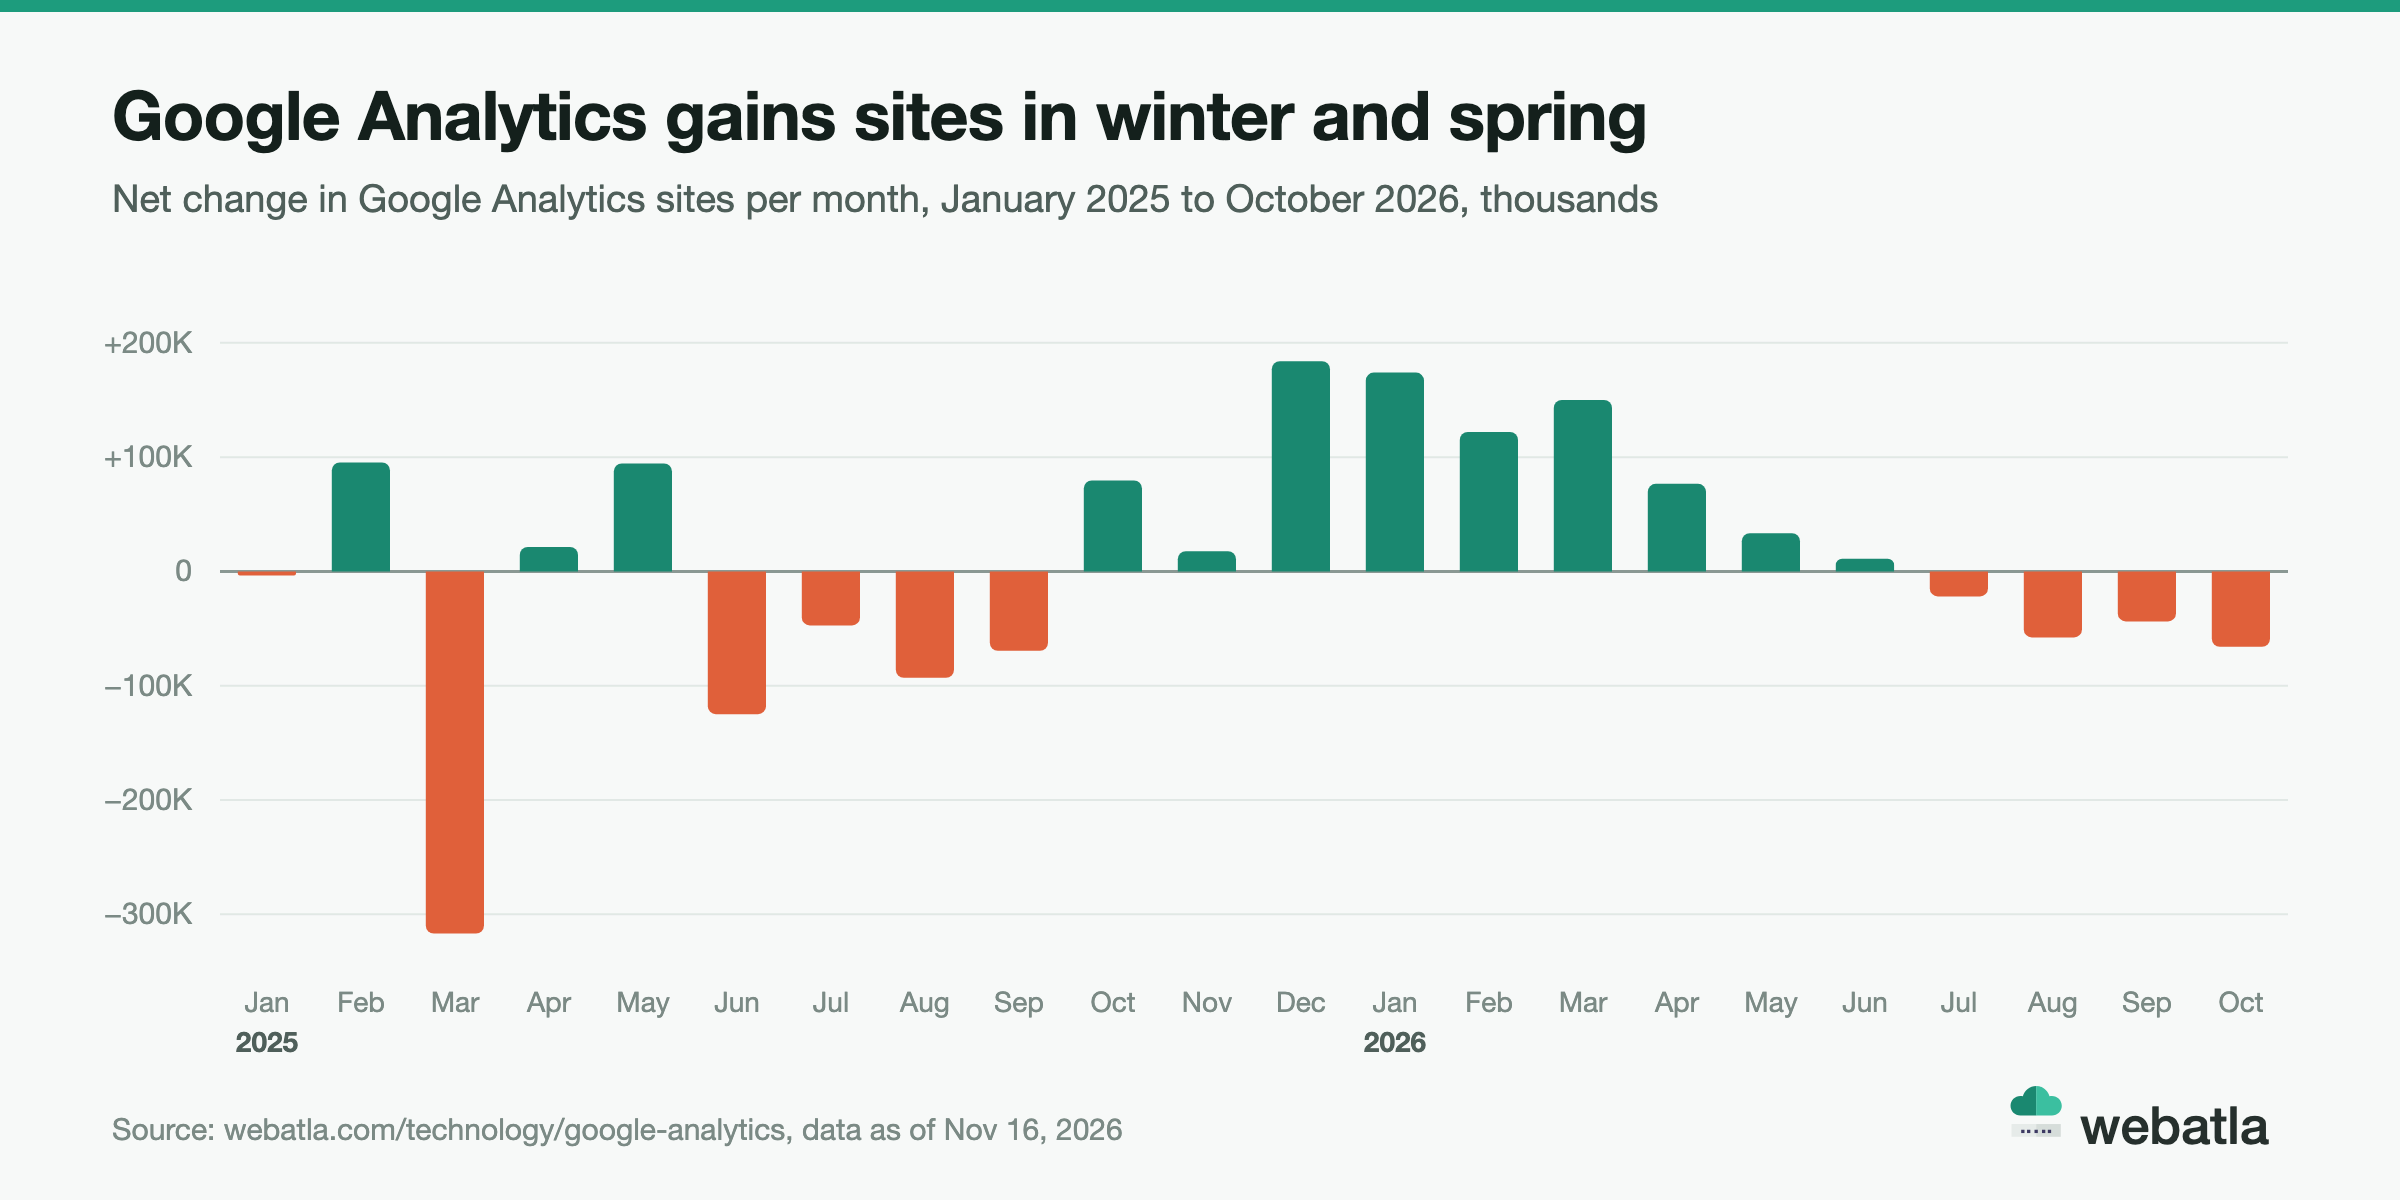
From December 2025 to May 2026 Google Analytics added a net 740,000 sites. December 2025 alone brought 184,000 and January 2026 another 174,000. Then from July to October 2026 it lost a net 189,000. In 2025 the summer loss was larger, about 335,000 from June to September.
One month stands out. In March 2025, 961,000 sites left Google Analytics, 705,000 of them by dropping the tag while staying online. The net loss of 317,000 is the largest monthly fall in the table from 2022 on. The count was back at 20 million by February 2026.
Google Analytics vs Microsoft Clarity, Hotjar, Fathom and others: who is growing
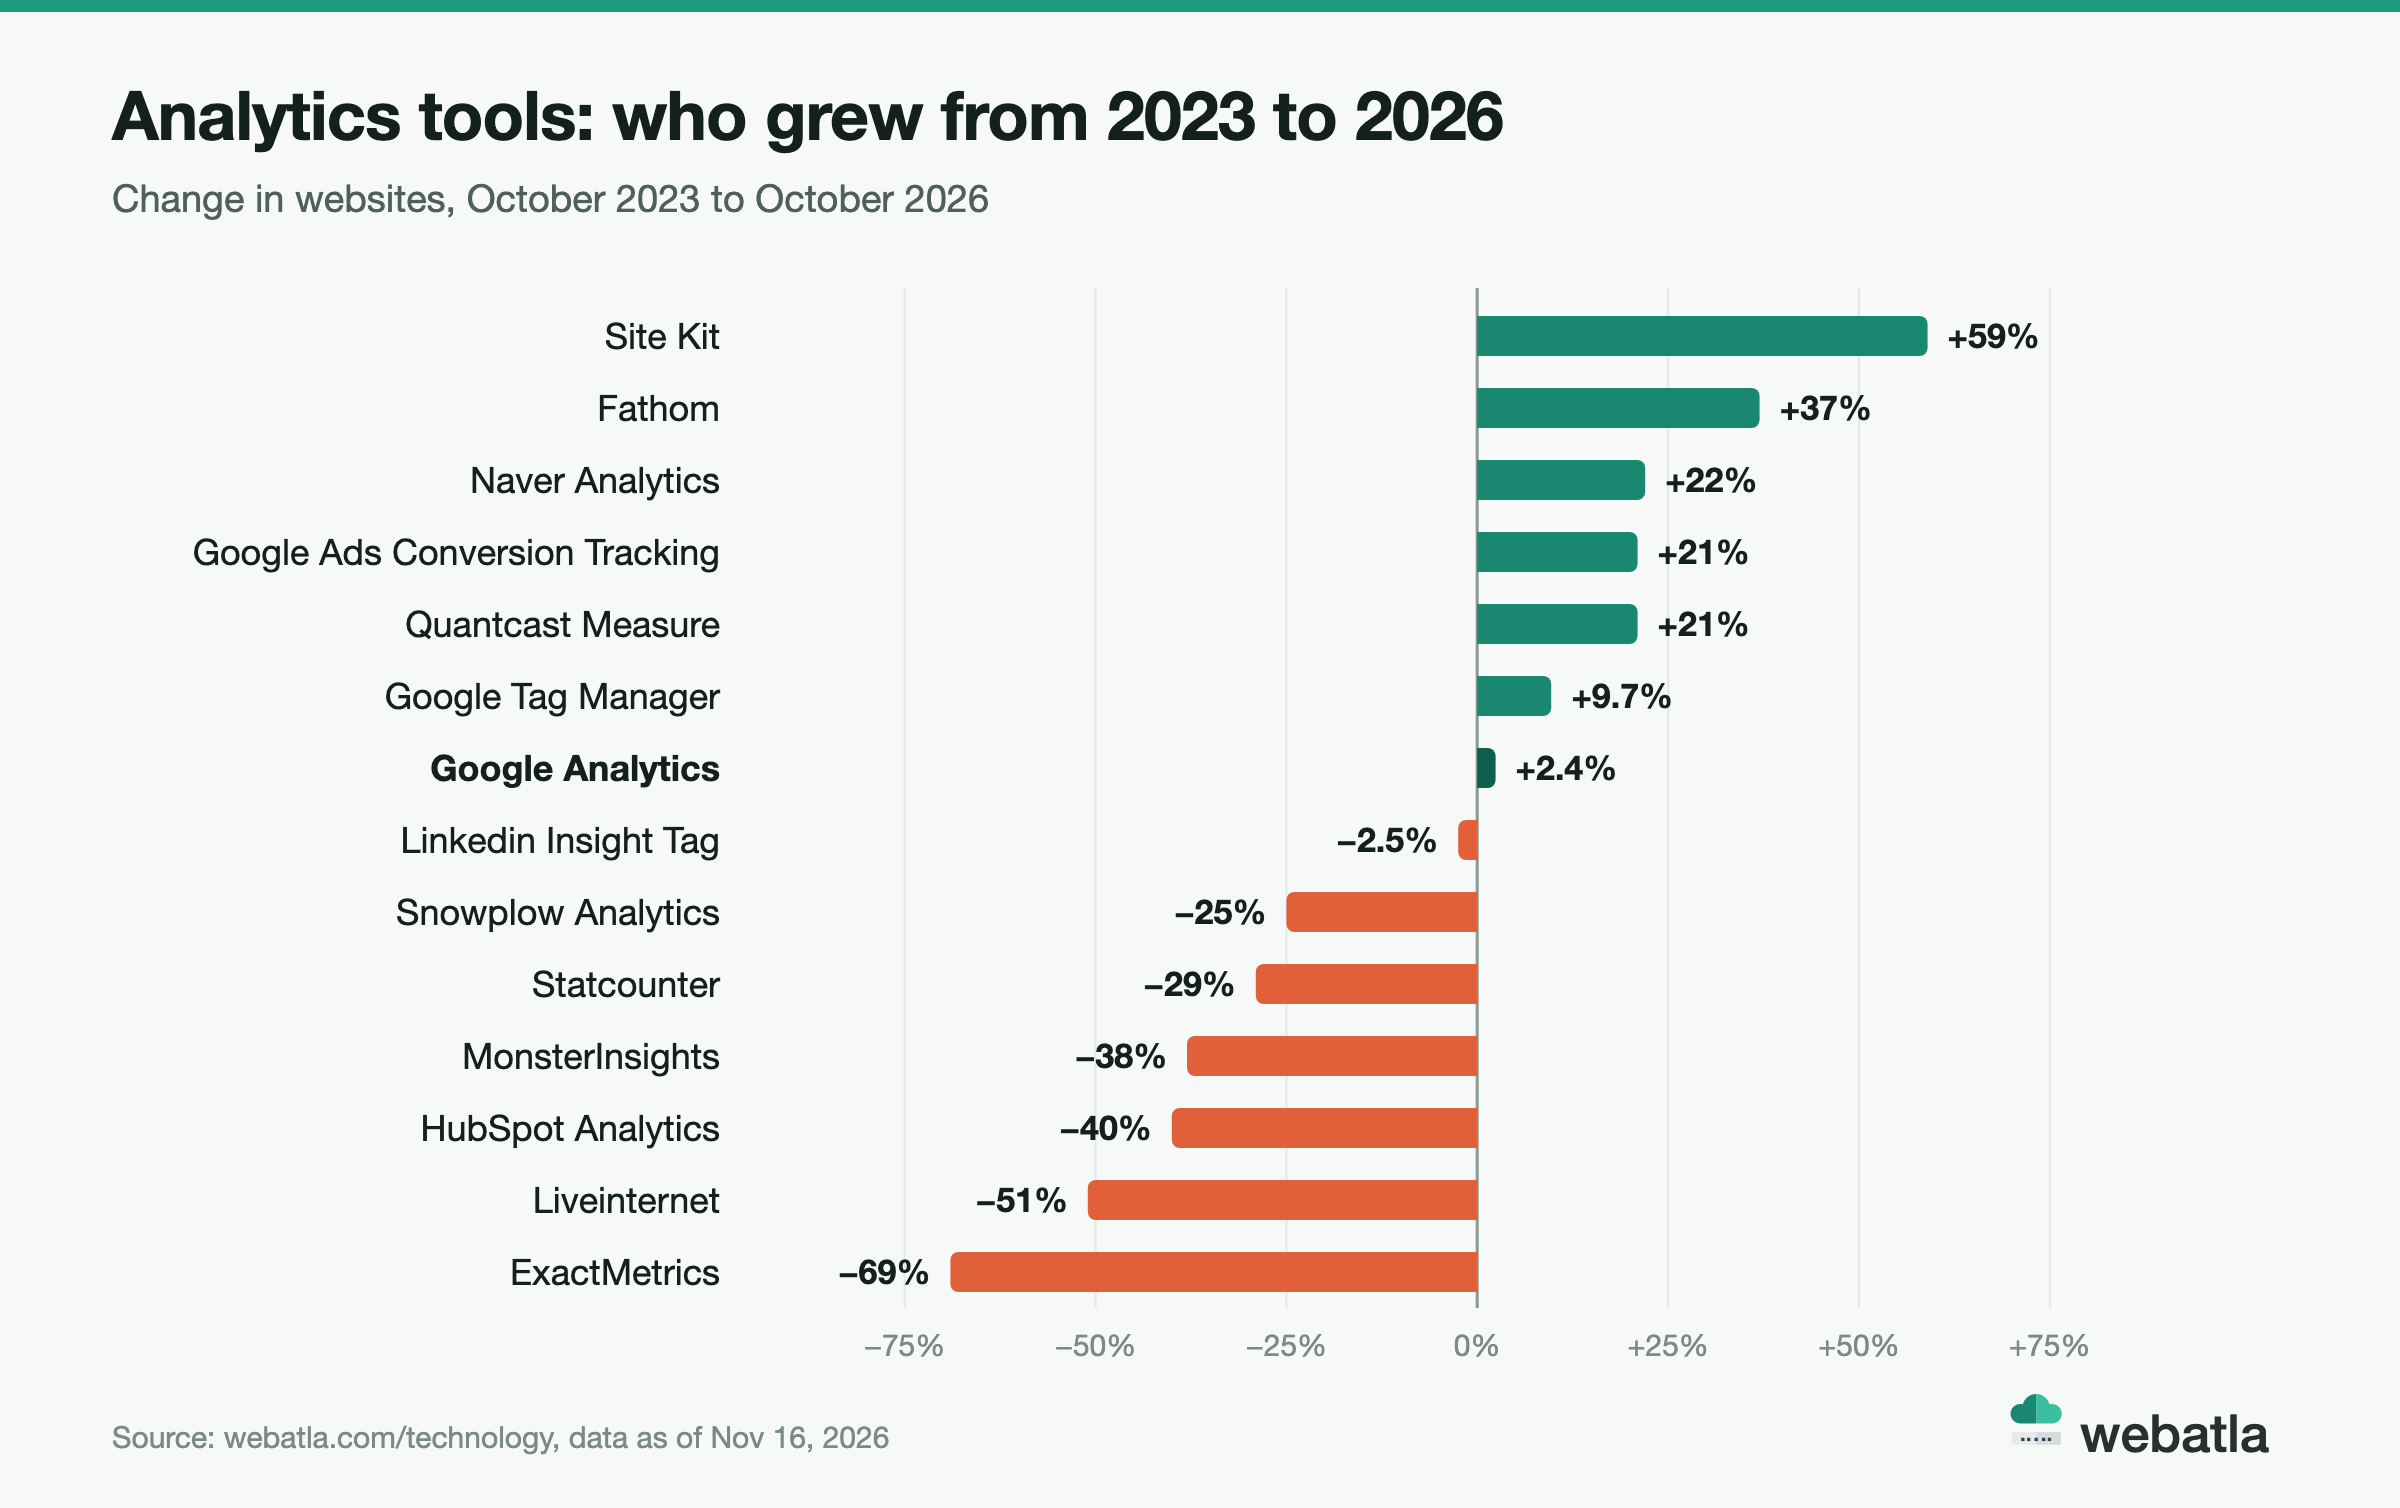
Google Analytics is the largest analytics tool by far, but not the fastest growing one. Here is how the tools with three years of history changed.
| Tool | Websites, Nov 2026 | Change, Oct 2023 to Oct 2026 | Change, last 12 months |
|---|---|---|---|
| Google Analytics | 20,171,372 | +2.4% | +3% |
| Google Tag Manager | 7,226,750 | +9.7% | +0.9% |
| Site Kit | 3,345,975 | +59% | +10% |
| Google Ads Conversion Tracking | 1,666,062 | +21% | +10% |
| MonsterInsights | 400,328 | -38% | -23% |
| Naver Analytics | 301,016 | +22% | +8% |
| Liveinternet | 187,500 | -51% | -24% |
| Quantcast Measure | 132,064 | +21% | +1.2% |
| Statcounter | 110,237 | -29% | -17% |
| PostHog | 110,102 | +146% since May 2025 | +112% |
| HubSpot Analytics | 99,702 | -40% | -17% |
| Fathom | 94,735 | +37% | +7.9% |
| Snowplow Analytics | 76,438 | -25% | +8% |
| ExactMetrics | 45,720 | -69% | -34% |
Product analytics is the fastest riser. PostHog more than doubled in the last 12 months, +112%, and now runs on 110,102 sites. In that year 57,600 sites switched to it and only 29,700 dropped it.
Fathom leads the privacy-first group. It grew 37% in three years to 94,735 sites. In the last 12 months 17,900 new sites started with it against 15,500 closures, and 15,700 sites switched to it against 11,200 that left.
Older trackers are fading. Statcounter lost 29% in three years and Liveinternet 51%. HubSpot Analytics fell 40%.
Plugins that only wrap Google Analytics are shrinking. MonsterInsights lost 38% and ExactMetrics 69%, while Site Kit, Google's own plugin, grew 59%. More on that in the companion section below.
Microsoft Clarity, Hotjar, Facebook Pixel and TikTok Pixel have no three-year history on their pages yet, so they are not in the chart.
GA4 vs UA: Google Analytics version statistics
webatla records which generation of the tag each site runs. On the Google Analytics page the two values are GA4 and UA.
| Tag type | Sites | Share of known values |
|---|---|---|
| GA4 | 7,303,024 | 71.1% |
| UA | 2,974,610 | 28.9% |
GA4 is the current generation and it leads by 2.5 to 1. The tag type is known for 10,277,634 values, and 7,303,024 of them are GA4.
2,974,610 values are still UA. UA is the previous generation and it no longer collects data. A site that carries only the UA tag is a site whose front end nobody has updated since UA stopped collecting. A site that carries both is either in the middle of a move or was never cleaned up. Both groups say something specific about how actively the site is run.
Each row in the file also holds the measurement IDs found on the site, such as G- and UA- identifiers. Sites that share an ID are almost always run by the same team, and that link holds across brands, registrars and hosting. No directory of sites can answer that question. The full list can.
The stack around Google Analytics
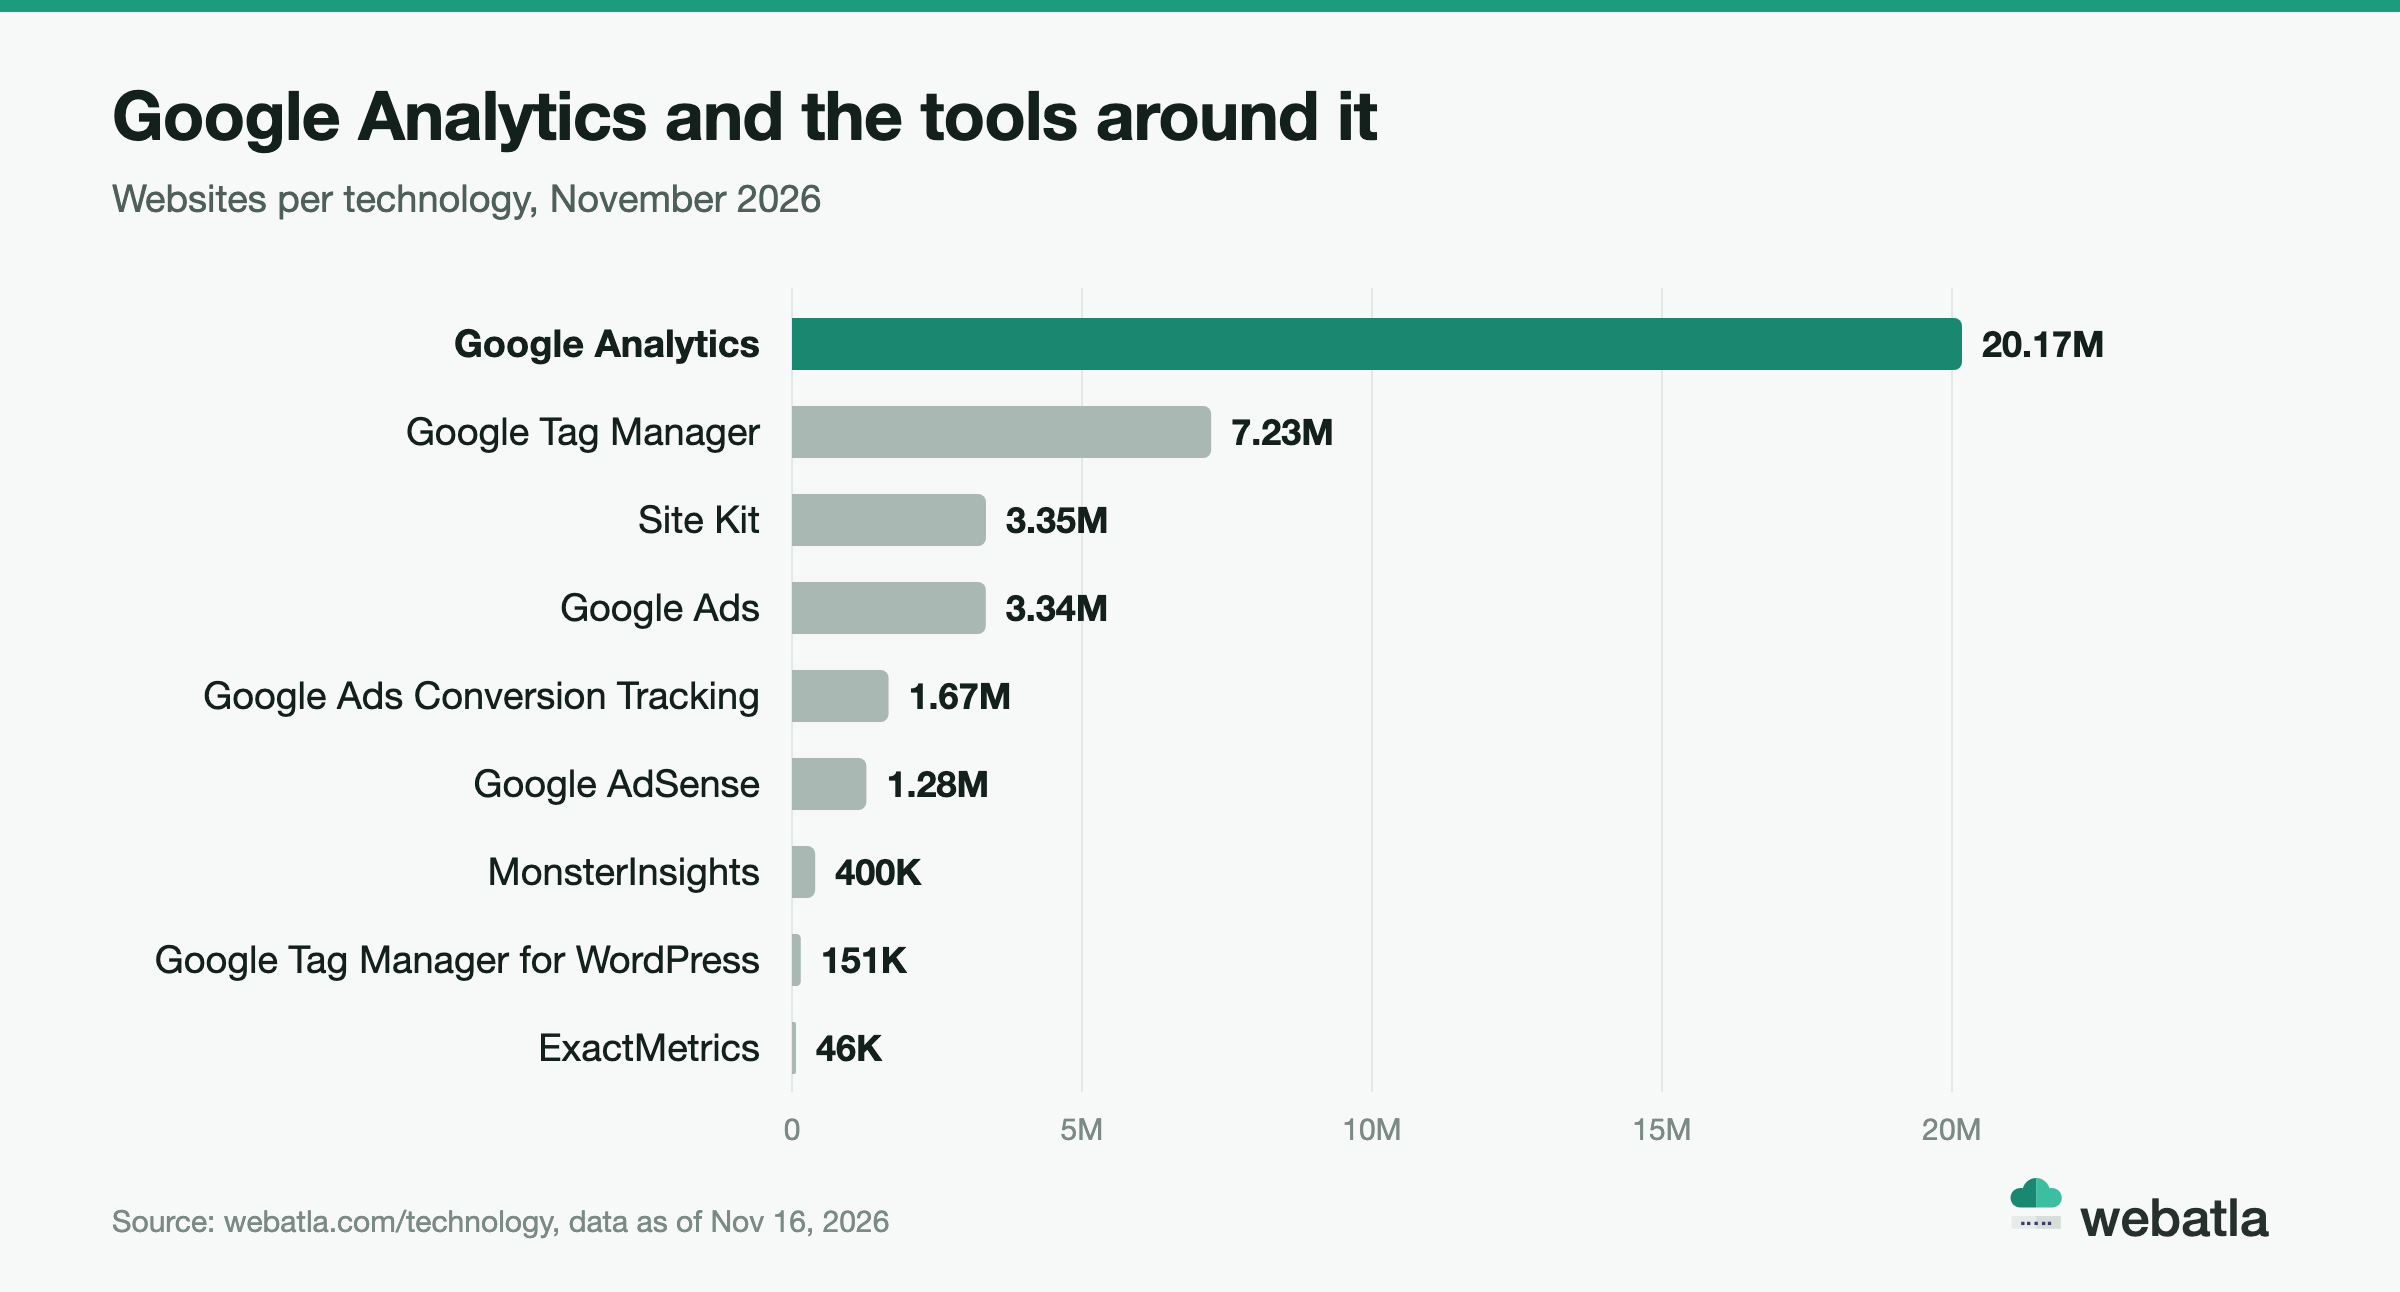
A set of companion tools grows around Google Analytics. They show how sites deploy it and what they do with the data.
| Technology | Category on webatla | Websites | Change, Oct 2023 to Oct 2026 |
|---|---|---|---|
| Google Tag Manager | Tag managers | 7,226,750 | +9.7% |
| Site Kit | Analytics, WordPress plugins | 3,345,975 | +59% |
| Google Ads | Advertising | 3,341,059 | n/a |
| Google Ads Conversion Tracking | Analytics | 1,666,062 | +21% |
| Google AdSense | Advertising | 1,282,226 | -28% |
| MonsterInsights | Analytics, WordPress plugins | 400,328 | -38% |
| Google Tag Manager for WordPress | WordPress plugins | 150,747 | -23% |
| ExactMetrics | Analytics, WordPress plugins | 45,720 | -69% |
| Google Analytics Enhanced eCommerce | Analytics | 5,256 | n/a |
Google Tag Manager
Google Tag Manager runs on 7,226,750 sites, about a third of the Google Analytics count. A tag manager is a container: it lets a marketing team add and change tracking without touching the site's code. Its presence is a sign that someone at the company owns marketing as a separate job.
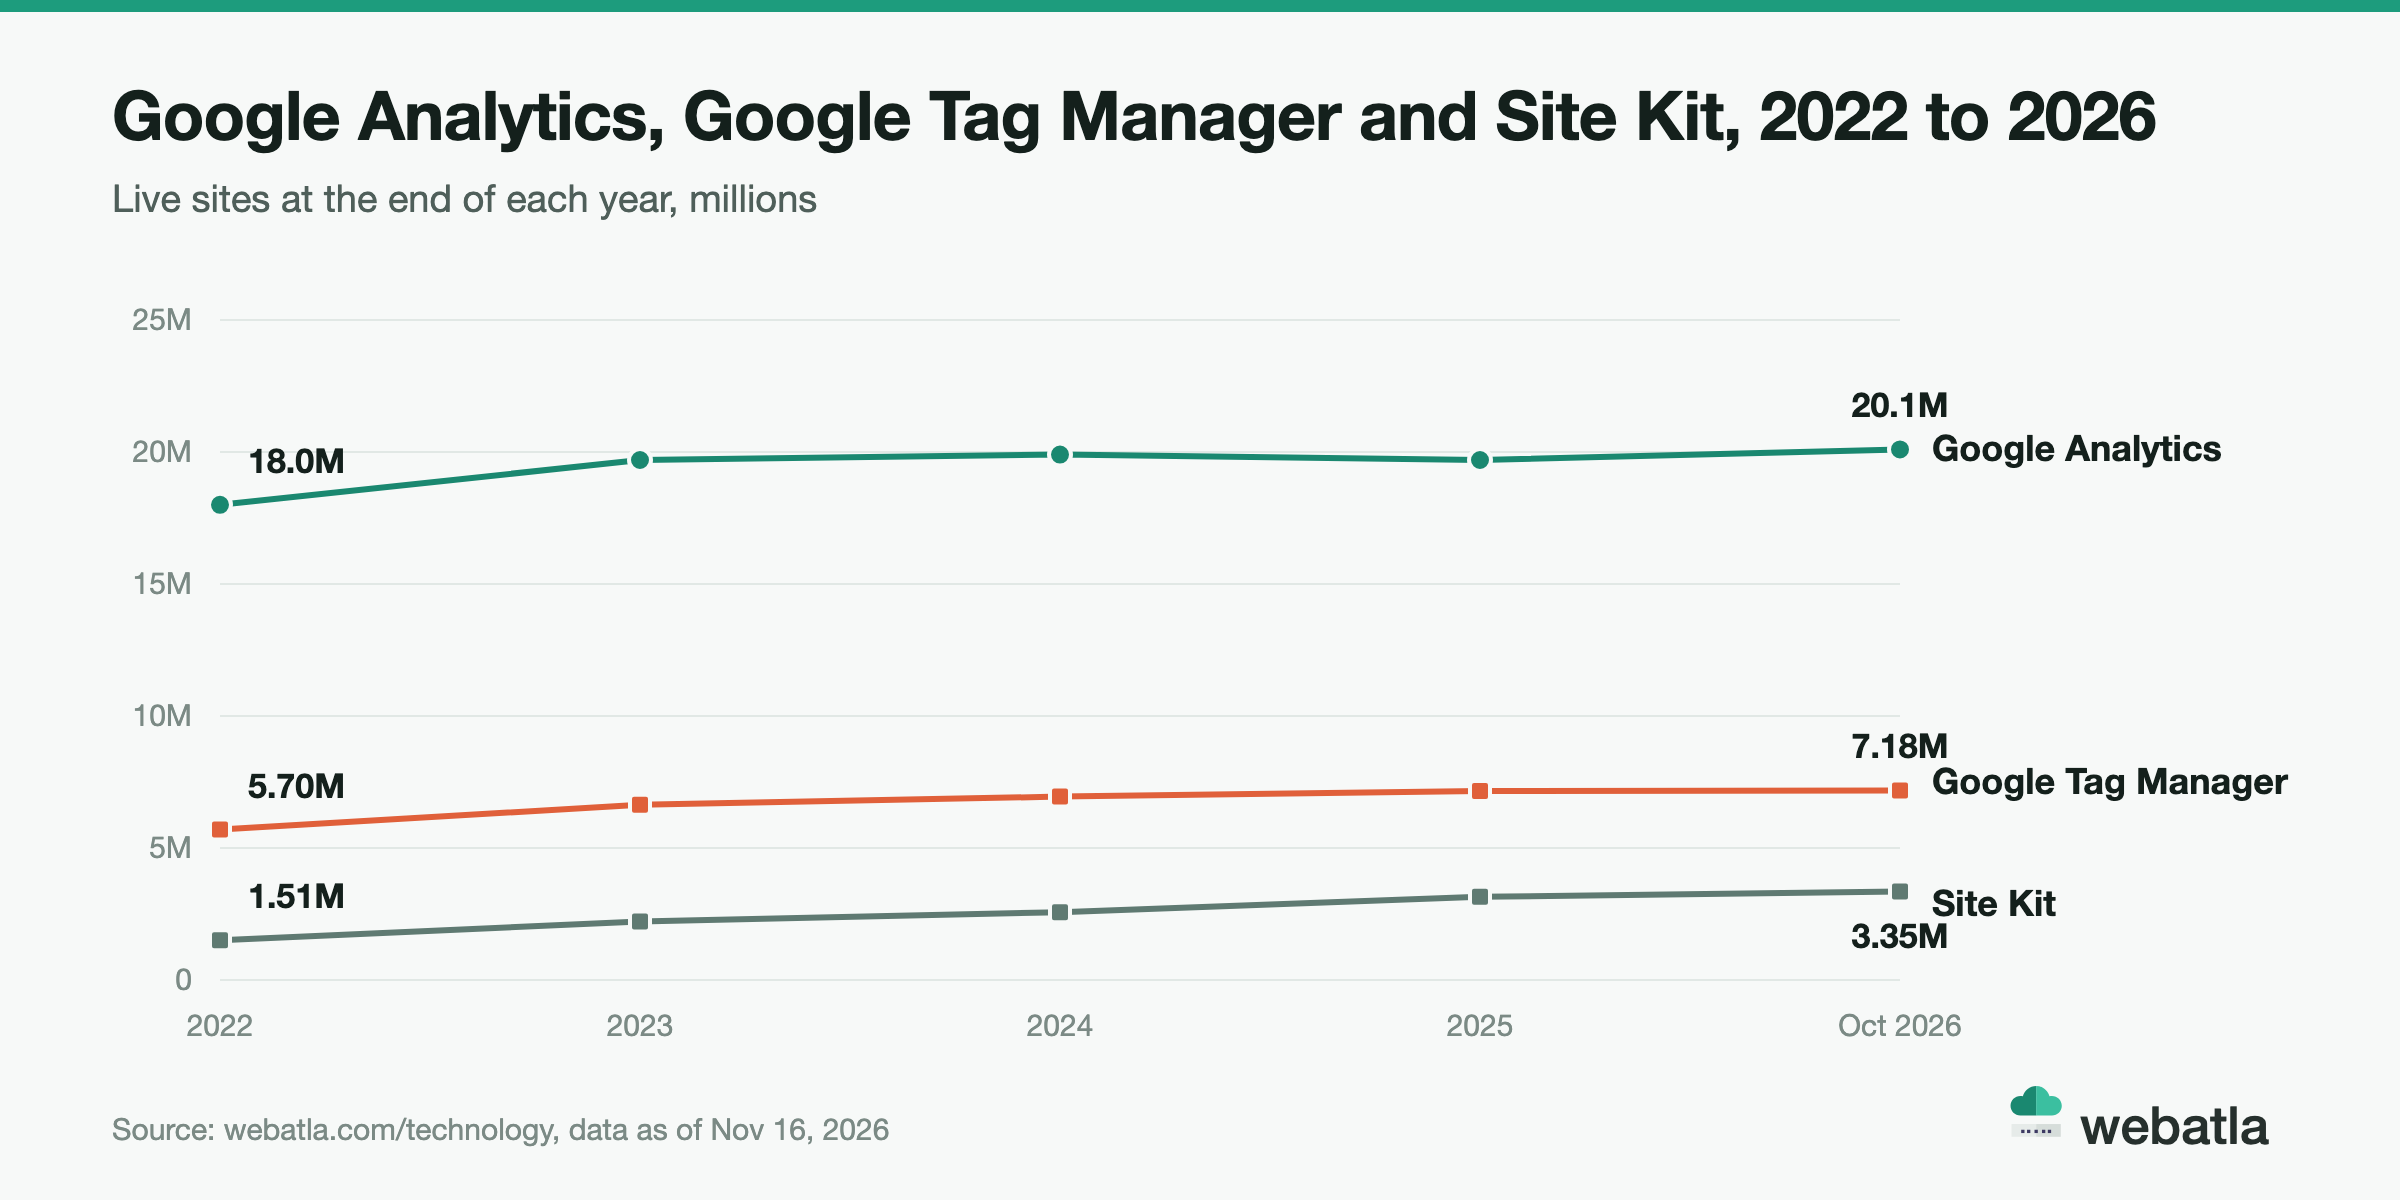
From the end of 2022 to October 2026 Google Tag Manager went from 5.70 million sites to 7.18 million, +26%. Google Analytics went from 18.0 million to 20.1 million, +12%, over the same period. The gap is narrowing: Google Analytics had 3.2 times as many sites as Google Tag Manager at the end of 2022 and 2.8 times as many in October 2026.
Site Kit and the WordPress plugins
On WordPress, Google's own plugin leads. Site Kit runs on 3,345,975 sites, equal to 14.2% of the WordPress base, about one WordPress site in seven. It went from 1.51 million sites at the end of 2022 to 3.35 million in October 2026, more than twice as many.
Other analytics plugins for WordPress are losing ground. MonsterInsights runs on 400,328 sites (1.7% of the WordPress base) and lost 38% in three years. ExactMetrics fell 69% and Google Tag Manager for WordPress 23%. In the last 12 months 52,400 sites switched to MonsterInsights and 138,000 dropped it.
Ads and e-commerce
Google Ads appears on 3,341,059 sites and Google Ads Conversion Tracking on 1,666,062, up 21% in three years. Google AdSense fell 28% to 1,282,226 sites. Google Analytics Enhanced eCommerce, which needs a developer to push product and checkout events into the tracker, shows up on only 5,256 sites.
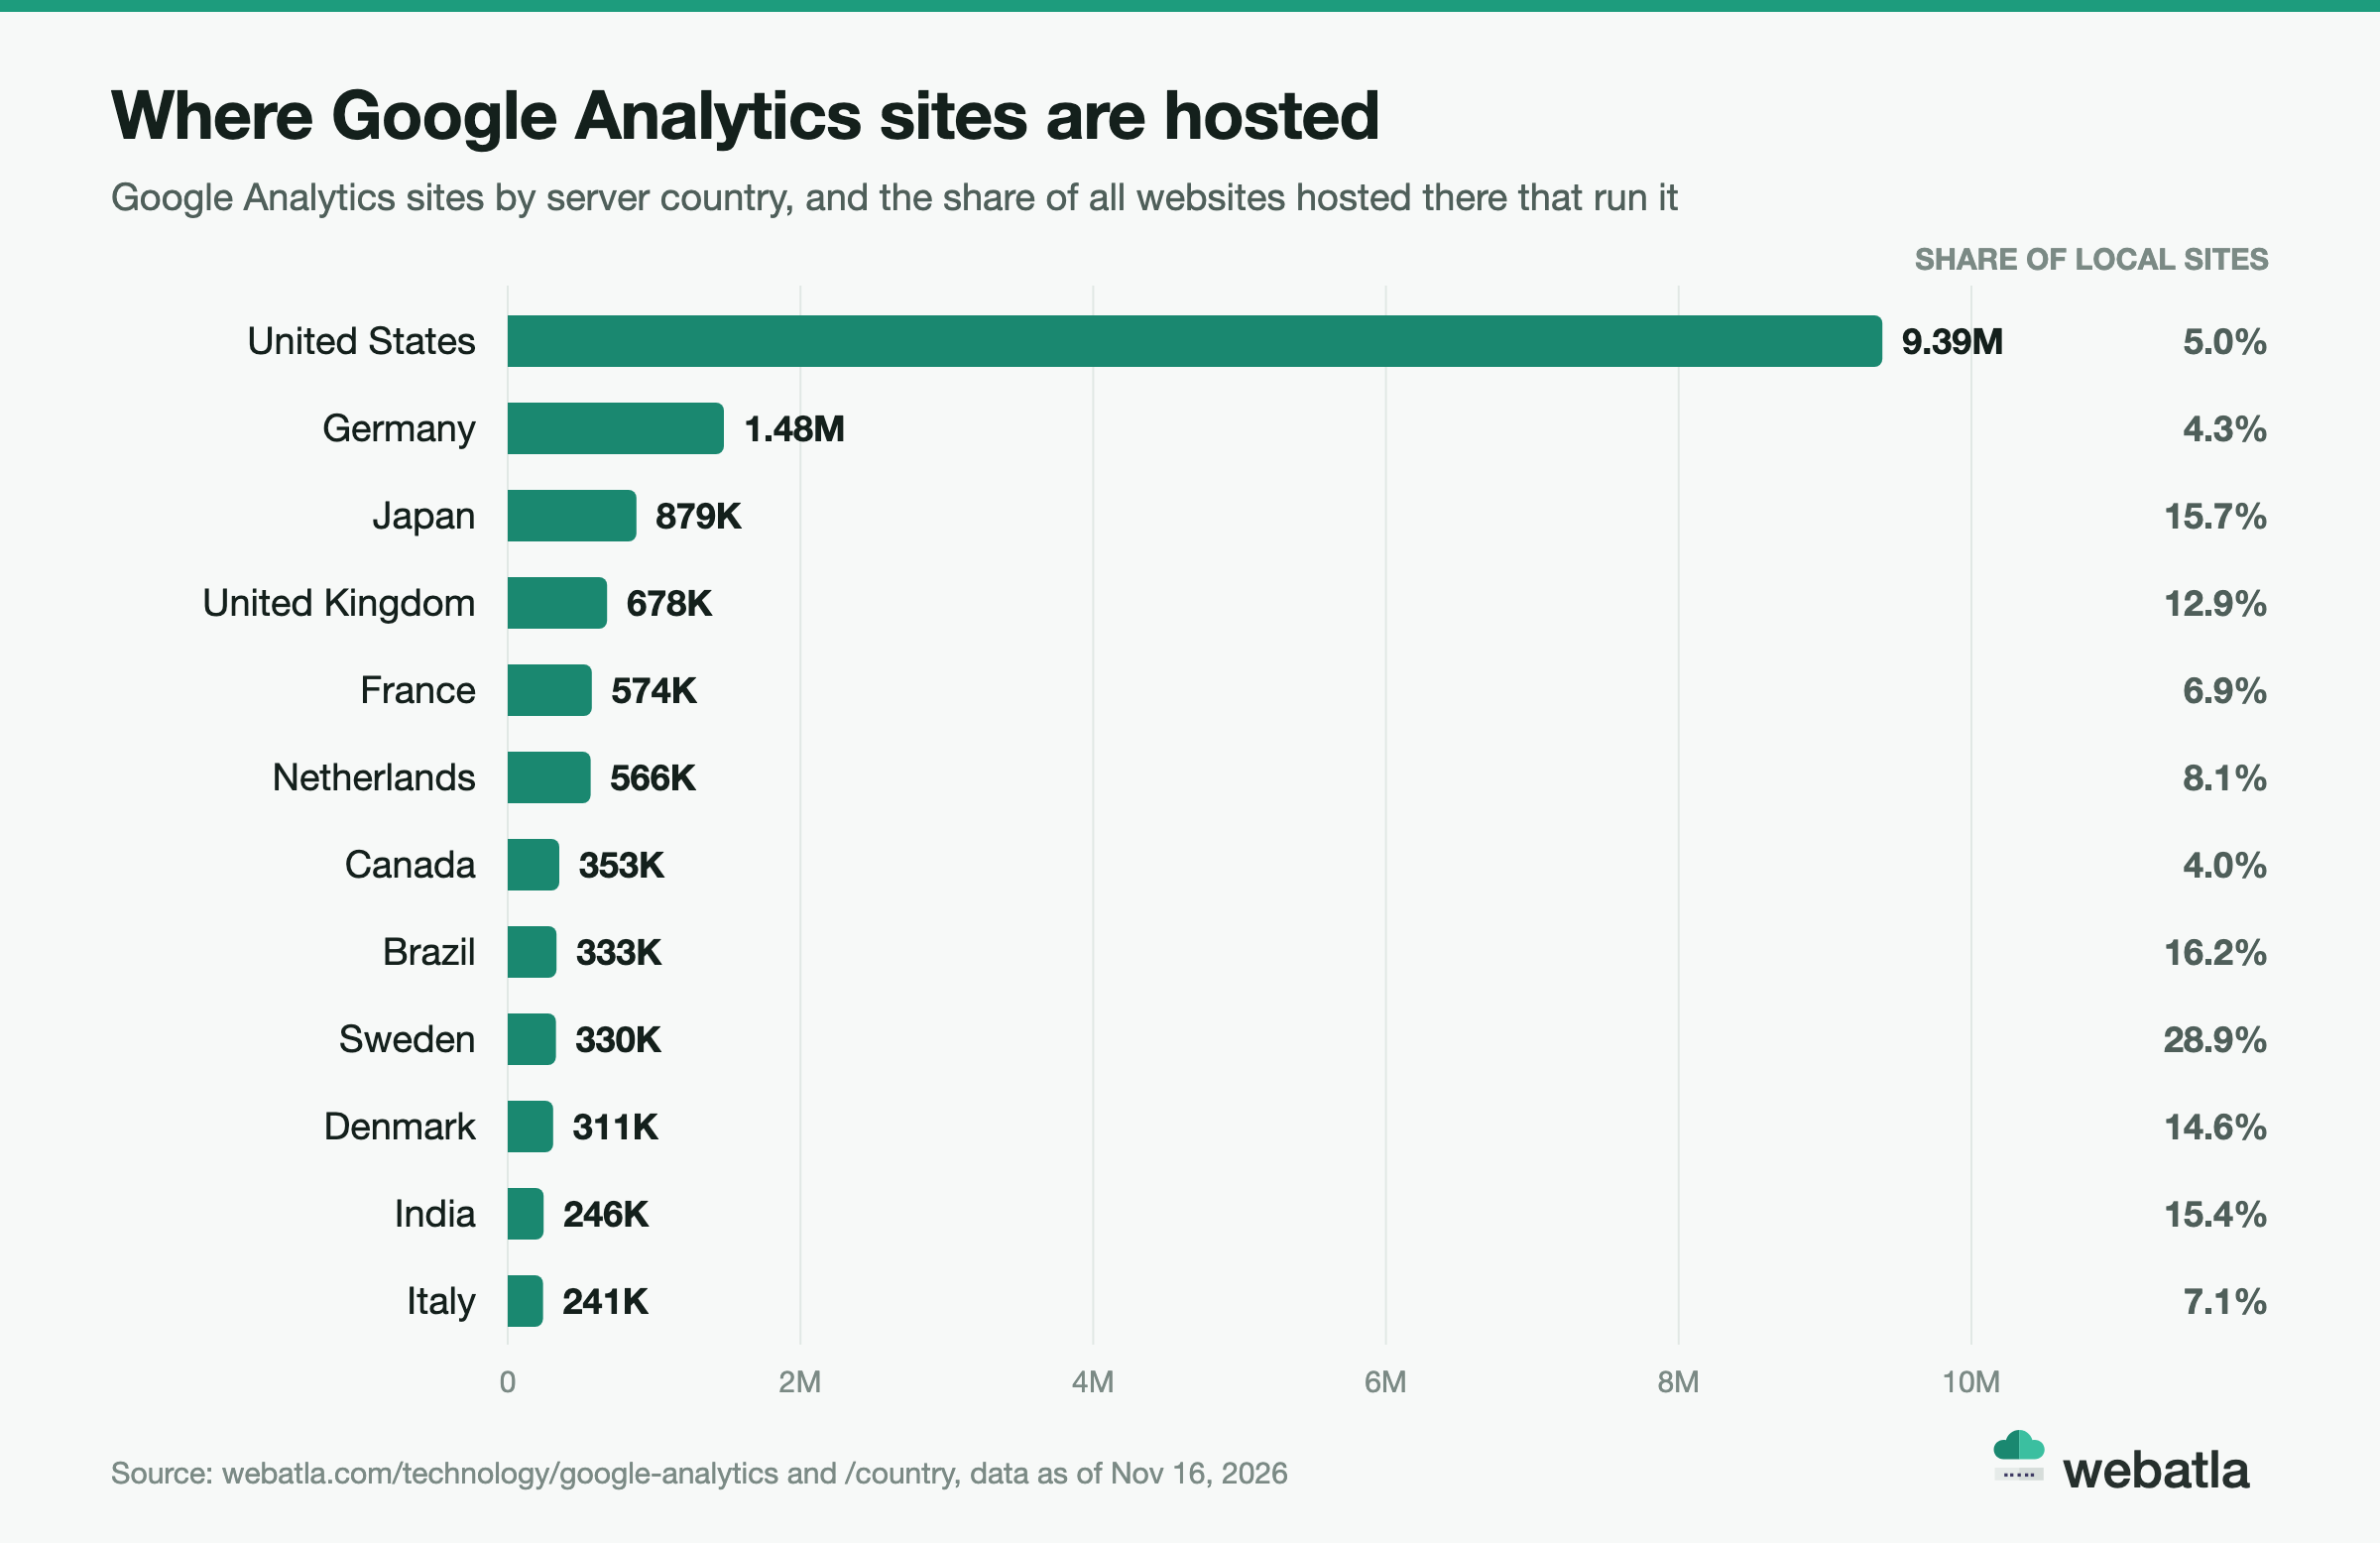
Google Analytics usage by country
Country here means where the site's server is, by IP address, not where the owner lives.
| Hosting country | Google Analytics sites | Share of Google Analytics sites | Google Analytics share of local websites |
|---|---|---|---|
| United States | 9,392,109 | 51.3% | 5.0% |
| Germany | 1,477,383 | 8.1% | 4.3% |
| Japan | 879,016 | 4.8% | 15.7% |
| United Kingdom | 678,191 | 3.7% | 12.9% |
| France | 574,225 | 3.1% | 6.9% |
| Netherlands | 566,090 | 3.1% | 8.1% |
| Canada | 352,832 | 1.9% | 4.0% |
| Brazil | 333,274 | 1.8% | 16.2% |
| Sweden | 329,784 | 1.8% | 28.9% |
| Denmark | 310,890 | 1.7% | 14.6% |
| India | 245,856 | 1.3% | 15.4% |
| Italy | 241,099 | 1.3% | 7.1% |
The United States hosts 51.3% of all Google Analytics sites, 9.39 million of them. Germany is a distant second with 1.48 million.
The last column shows how common Google Analytics is among all websites hosted in each country, and here the order changes completely. In Sweden 28.9% of hosted websites run it, in Ireland 18.8%, in Brazil 16.2% and in Japan 15.7%. In the US the share is only 5.0%, because US servers host 187 million websites, more than half of the whole web.
Germany is the surprise. It hosts 34.6 million websites, more than any country except the US, but only 4.3% of them run Google Analytics. Russia (3.8%) and Australia (2.9%) are even lower.
Where local tools compete
In two markets local analytics tools hold their own.
- South Korea. Naver Analytics runs on 207,148 sites hosted in South Korea, 70.3% of its total. Google Analytics has 99,302 sites hosted there. In this market the local tool has about twice as many sites.
- Russia. Google Analytics still leads with 204,681 Russia-hosted sites. Liveinternet has 102,562 sites hosted there and Yandex.Metrika 81,709. Liveinternet is shrinking fast, -51% in three years.
Google Analytics by domain extension
45.1% of Google Analytics sites use a .com domain, 9.09 million sites. The UK's .uk comes second, ahead of .org.
| TLD | Google Analytics sites | Share of Google Analytics sites | Share of all websites on the TLD |
|---|---|---|---|
| .com | 9,091,944 | 45.1% | 6.0% |
| .uk | 751,434 | 3.7% | 9.0% |
| .org | 606,693 | 3.0% | 5.5% |
| .br | 570,795 | 2.8% | 17.3% |
| .net | 432,587 | 2.1% | 4.1% |
| .nl | 407,540 | 2.0% | 9.5% |
| .jp | 347,583 | 1.7% | 24.3% |
| .de | 343,555 | 1.7% | 2.2% |
| .fr | 302,627 | 1.5% | 9.3% |
| .au | 281,097 | 1.4% | 9.8% |
| .shop | 252,583 | 1.3% | 7.1% |
| .se | 240,049 | 1.2% | 19.2% |
The last column compares each count with all websites on that extension. Almost one in four .jp websites runs Google Analytics (24.3%), and the share is 19.2% on .se and 17.3% on .br. On .de it is only 2.2%, which matches the low German share in the hosting data.
The extension data has one clear outlier. On Malaysia's .my, 201,101 of 387,288 websites run Google Analytics, 51.9%. The newer .shop extension already has 252,583 Google Analytics sites, more than .se or .xyz.
Google Analytics and cookie consent tools
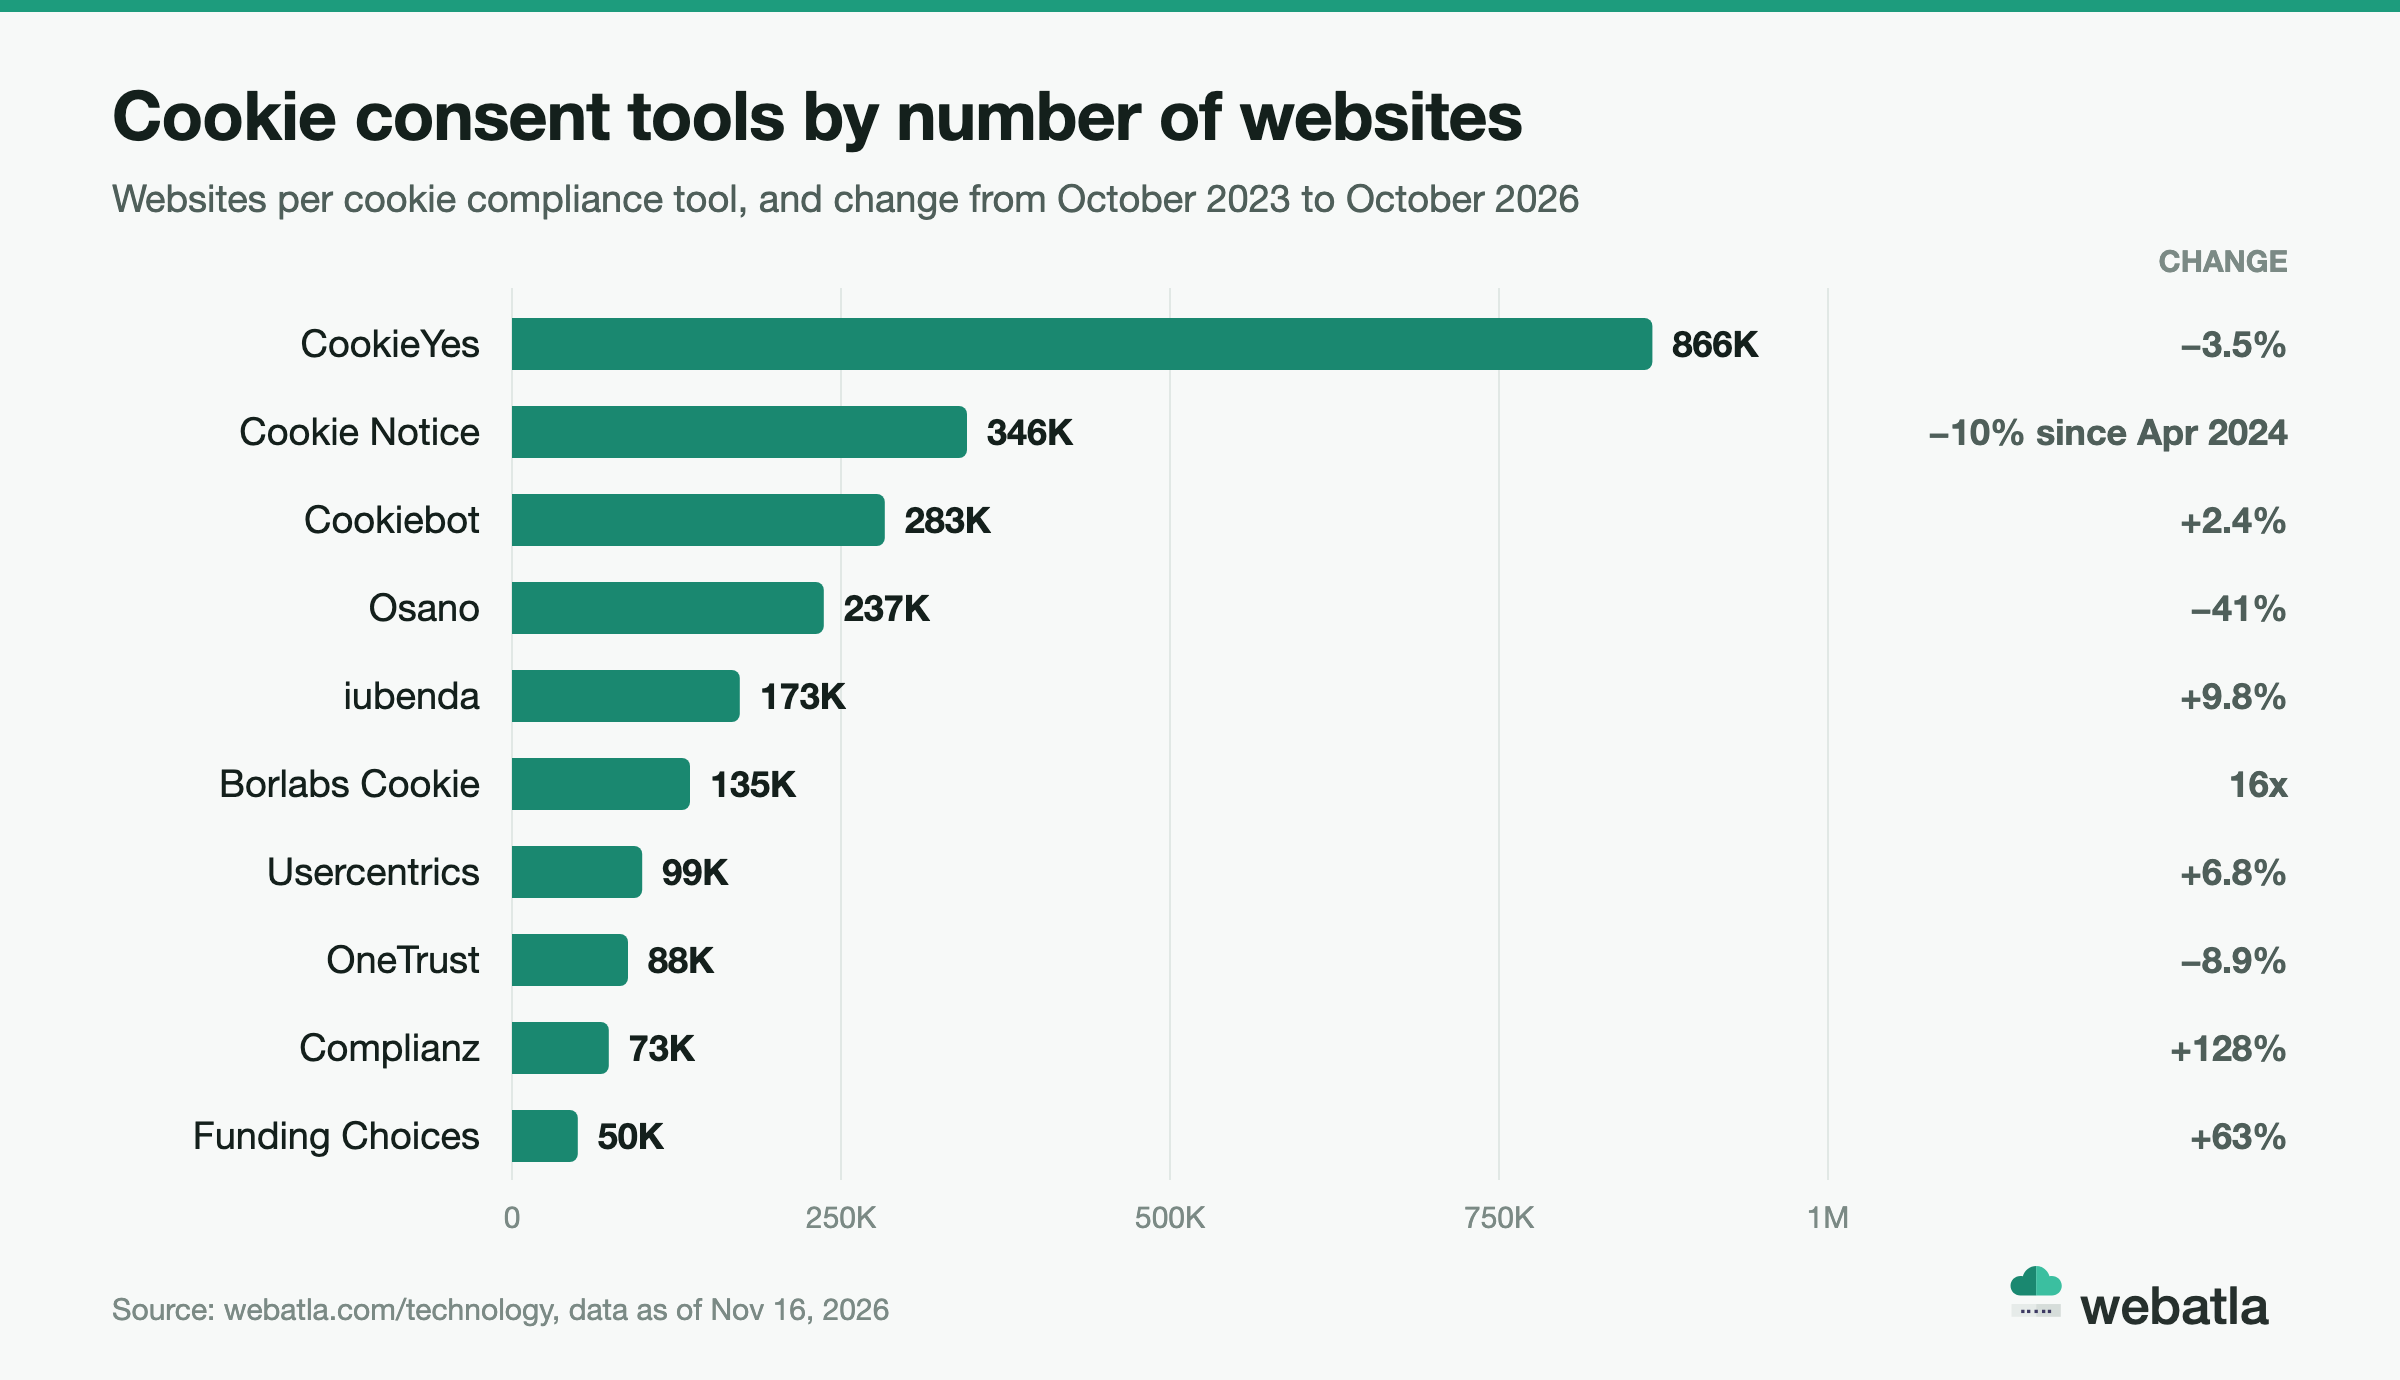
Consent banners and managers form their own group, the Cookie compliance category on webatla.
| Consent tool | Websites | Change, Oct 2023 to Oct 2026 |
|---|---|---|
| CookieYes | 866,498 | -3.5% |
| Cookie Notice | 345,708 | -10% since April 2024 |
| Cookiebot | 283,338 | +2.4% |
| Osano | 236,902 | -41% |
| iubenda | 173,100 | +9.8% |
| Borlabs Cookie | 135,190 | 16x |
| Usercentrics | 99,005 | +6.8% |
| OneTrust | 88,130 | -8.9% |
| Complianz | 73,489 | +128% |
| Funding Choices | 50,030 | +63% |
The ten largest consent tools add up to 2.35 million installs, equal to 11.7% of the Google Analytics count. Among them the fastest growers are Borlabs Cookie, up 16 times in three years, Complianz (+128%) and Google's own Funding Choices (+63%).
Germany sits at the center of this market. 81.9% of Borlabs Cookie sites and 57.8% of Usercentrics sites are hosted there, and German-hosted websites are among the least likely to run Google Analytics. The data does not say why. It does show where analytics and consent vendors meet the same buyers.
What these Google Analytics statistics mean for business
A count of 20.2 million is a headline. The value is in the segments inside it, and each group of companies that sells into analytics looks for a different one.
Analytics and martech vendors start with the install base they want to win. 3.37 million sites dropped Google Analytics in the last 12 months, while PostHog (+112% in a year) and Fathom (+37% in three years) kept growing. A vendor can list every site that runs Google Analytics without a behavior tool, or every site that runs Hotjar and Microsoft Clarity side by side.
Agencies and consultants look for sites that need work. 2,974,610 values in the file are still UA, a tag that no longer collects data. Sites with only the UA tag are leads for a GA4 setup, sites with both tags are leads for a cleanup, and each can be filtered by country, TLD and the rest of its stack.
Consent and privacy vendors look at the gap between measurement and consent. Google Analytics runs on 20.17 million sites, while the ten largest consent tools together have 2.35 million installs. The list shows which Google Analytics sites run a consent tool webatla detects and which do not.
Ad platforms and performance marketers follow the conversion tags. Google Ads Conversion Tracking grew 21% in three years to 1,666,062 sites, Facebook Pixel runs on 2,418,694 and TikTok Pixel on 364,726. A conversion tag on a site is a sign of an active ad budget.
WordPress plugin vendors see a market in motion. Site Kit runs on 14.2% of WordPress sites and grew 59%, while MonsterInsights and ExactMetrics are losing sites. Daily files show which sites moved and what they run now.
Researchers, analysts and investors use the measurement IDs. Domains that share an ID are usually run by the same team, so grouping by ID maps brand portfolios, reseller networks and agency client lists that look unrelated on paper.
All of these questions are filters over the same full list. You run them on your own copy of the data, as narrow as you need, and you can keep yesterday's file to see what changed.
How webatla counts Google Analytics sites
A few notes on method, so you can read the numbers correctly.
- The count. 20,171,372 is every website where Google Analytics was detected in today's file, whatever its HTTP status. The file is rebuilt every day, and each row is one domain.
- The base. "Websites" means the 325,803,430 domains that answer with a web server. Market share against all websites uses this base.
- The peer group. Market share among analytics tools uses the 30.4 million installs of the 20 largest tools in the Analytics category, without the WordPress plugins Site Kit, MonsterInsights and PixelYourSite. A site with three tools counts three times in that base. The ad pixels and conversion tags are Facebook Pixel, Google Ads Conversion Tracking, TikTok Pixel, Pinterest Conversion Tag and Linkedin Insight Tag.
- History. Yearly and monthly figures come from webatla's monthly history of active sites, anchored to the webatla census of October 2026. The history reads archived page code, where only the current Google tag is recognized, so years before 2022 undercount Google Analytics and are left out. From November 2026 the counting model changed, so compare months with months and today's file with today's file.
- Tag types. GA4 and UA shares are of the 10,277,634 values where the tag type is known.
- Countries. The country is where the server is, by IP address. Shares of Google Analytics sites are of sites with a known country.
- Measurement IDs. A shared ID is strong evidence of shared administration, not proof of shared ownership. Agencies and hosting companies often deploy their own accounts across client sites.
Sites can hide or load their tags in ways that are hard to see, and a small share do. The numbers describe what is observable on the web, measured the same way every day.
Frequently asked questions about Google Analytics statistics
How many websites use Google Analytics?
20,171,372 websites use Google Analytics as of November 16, 2026, according to the webatla index. The count is refreshed every day on the Google Analytics technology page.
What percentage of websites use Google Analytics?
6.19% of all 325.8 million websites run Google Analytics, about one in 16.
What is the Google Analytics market share in 2026?
Google Analytics holds 66.5% of installs among the 20 largest analytics tools in November 2026. Cloudflare Browser Insights follows with 9.0% and Facebook Pixel with 8.0%. Without ad pixels and conversion tags, the Google Analytics share is 78.9%.
Is Google Analytics still growing in 2026?
Yes, slowly. It changed by +2.4% from October 2023 to October 2026 and by +3% in the last 12 months. In that year 6.9 million sites came to it and 6.32 million left.
How many websites use GA4 and how many still use UA?
7,303,024 sites run GA4 and 2,974,610 still carry the UA tag. GA4 has 71.1% of the sites where the tag type is known.
What is the most popular alternative to Google Analytics?
The largest other tool in the Analytics category is Cloudflare Browser Insights with 2,728,107 sites. Among dedicated behavior tools, Microsoft Clarity leads with 650,919 sites, ahead of Hotjar with 463,916.
How many websites use Google Tag Manager?
7,226,750 websites use Google Tag Manager, about a third of the Google Analytics count. It grew 9.7% from October 2023 to October 2026.
How many sites add Google Analytics every day?
About 18,900. In the last 12 months 3.36 million new sites started with Google Analytics and 3.54 million existing sites added it.
Which country has the most Google Analytics websites?
The United States, with 9,392,109 Google Analytics sites hosted there, 51.3% of the total. Germany is second with 1,477,383.
Get the full list of Google Analytics websites →
Every number in this article comes from one file. The webatla Google Analytics list holds all 20,171,372 websites running Google Analytics, one row per site, and it is rebuilt every day.
Each row gives you the domain, the full technology stack with versions and measurement IDs, the IP address, hosting country, HTTP status, social profiles, PageRank and Harmonic rank, and the domain's creation and expiry dates. That means you can go far past the headline count:
- every site still carrying the UA tag, by country,
- every Google Analytics site that also runs Hotjar or Microsoft Clarity,
- every group of domains that shares one measurement ID,
- every site that added Google Analytics since yesterday's file.
The Google Analytics list comes with the Technologies dataset for €159 a month: 313,947,451 websites, 3,000+ technologies, and ready files by technology, country and TLD. You can also download a free 20-row preview to see the format.