Quick Facts: Next.js Statistics in November 2026
- 1,973,502 websites use Next.js as of November 16, 2026. This is the live count on the Next.js technology page, rebuilt every day.
- Next.js runs on 0.61% of the 325.8 million websites webatla tracks, about one site in 165.
- It is the third largest JavaScript framework webatla detects, after React (11,053,868) and Vue.js (2,061,594). Vue.js is only 88,092 sites ahead.
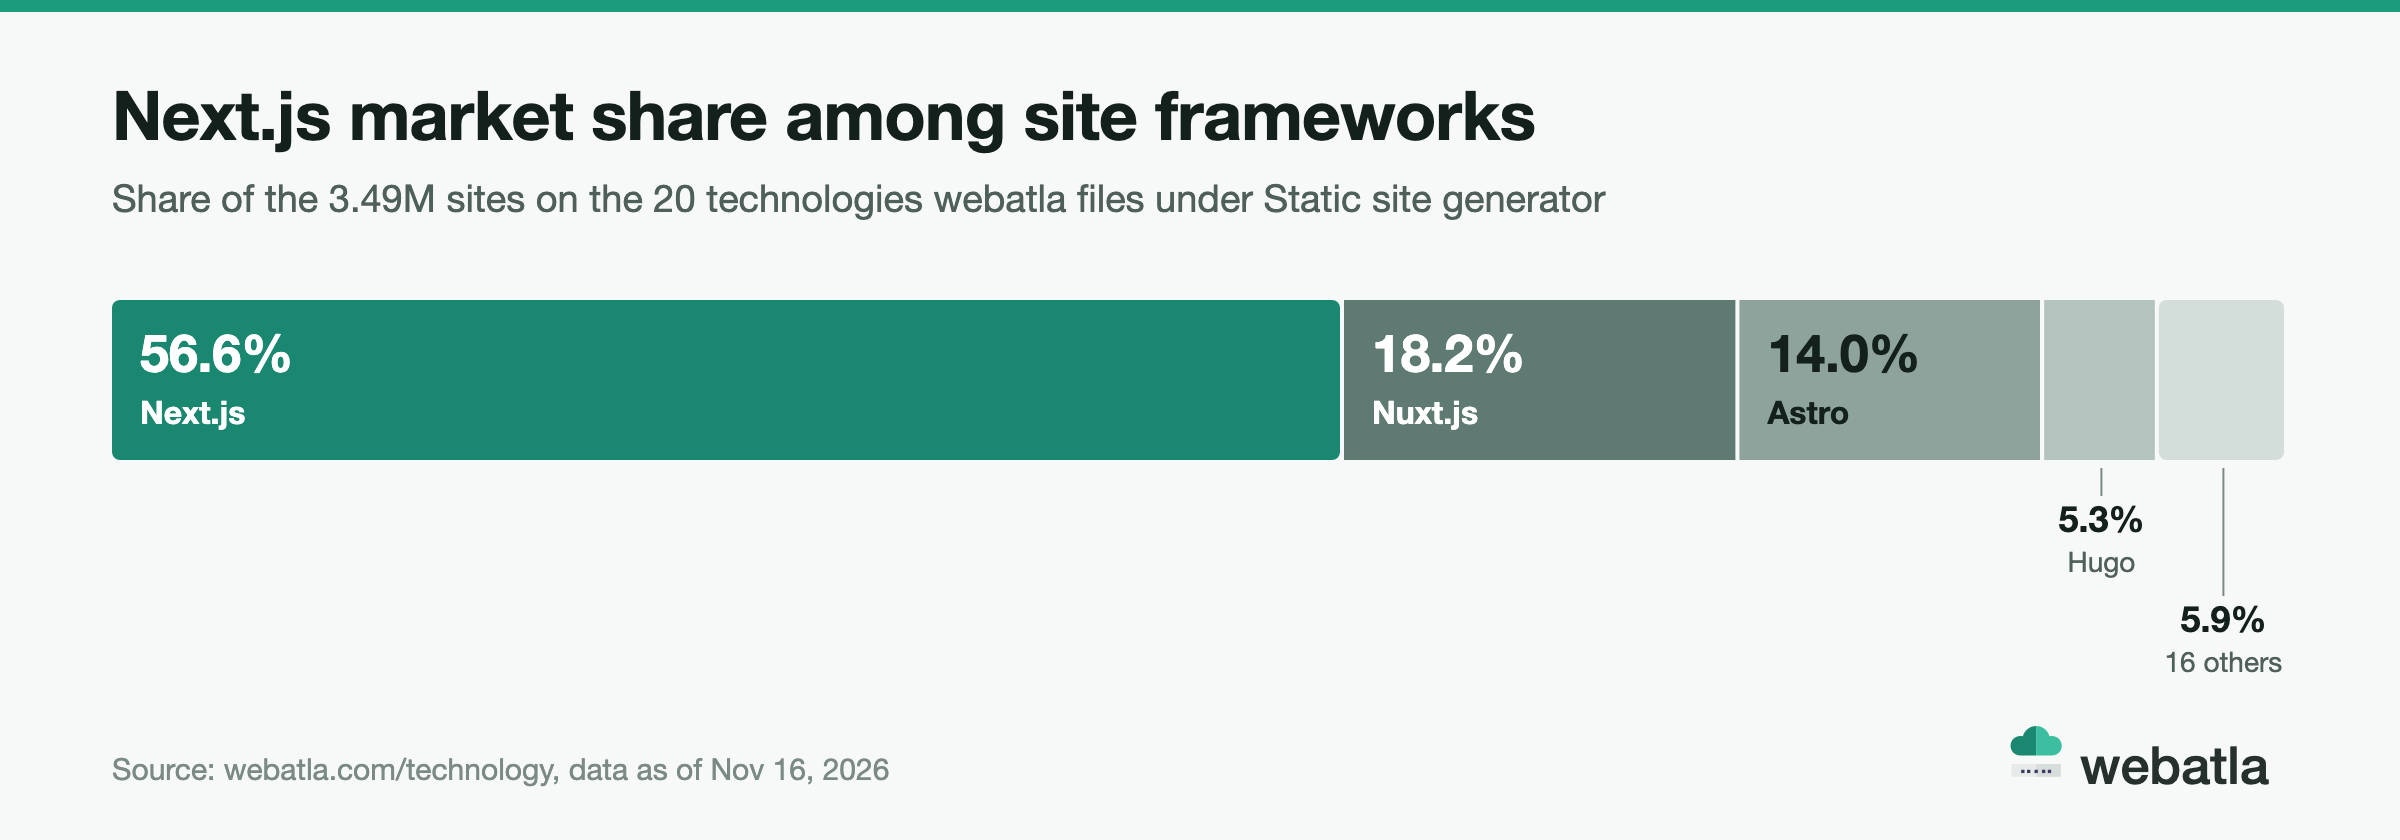
- Among the 20 site frameworks and static site generators webatla tracks, Next.js has a 56.6% market share.
- The count grew by +448% from October 2023 to October 2026 and by +117% over the last 12 months.
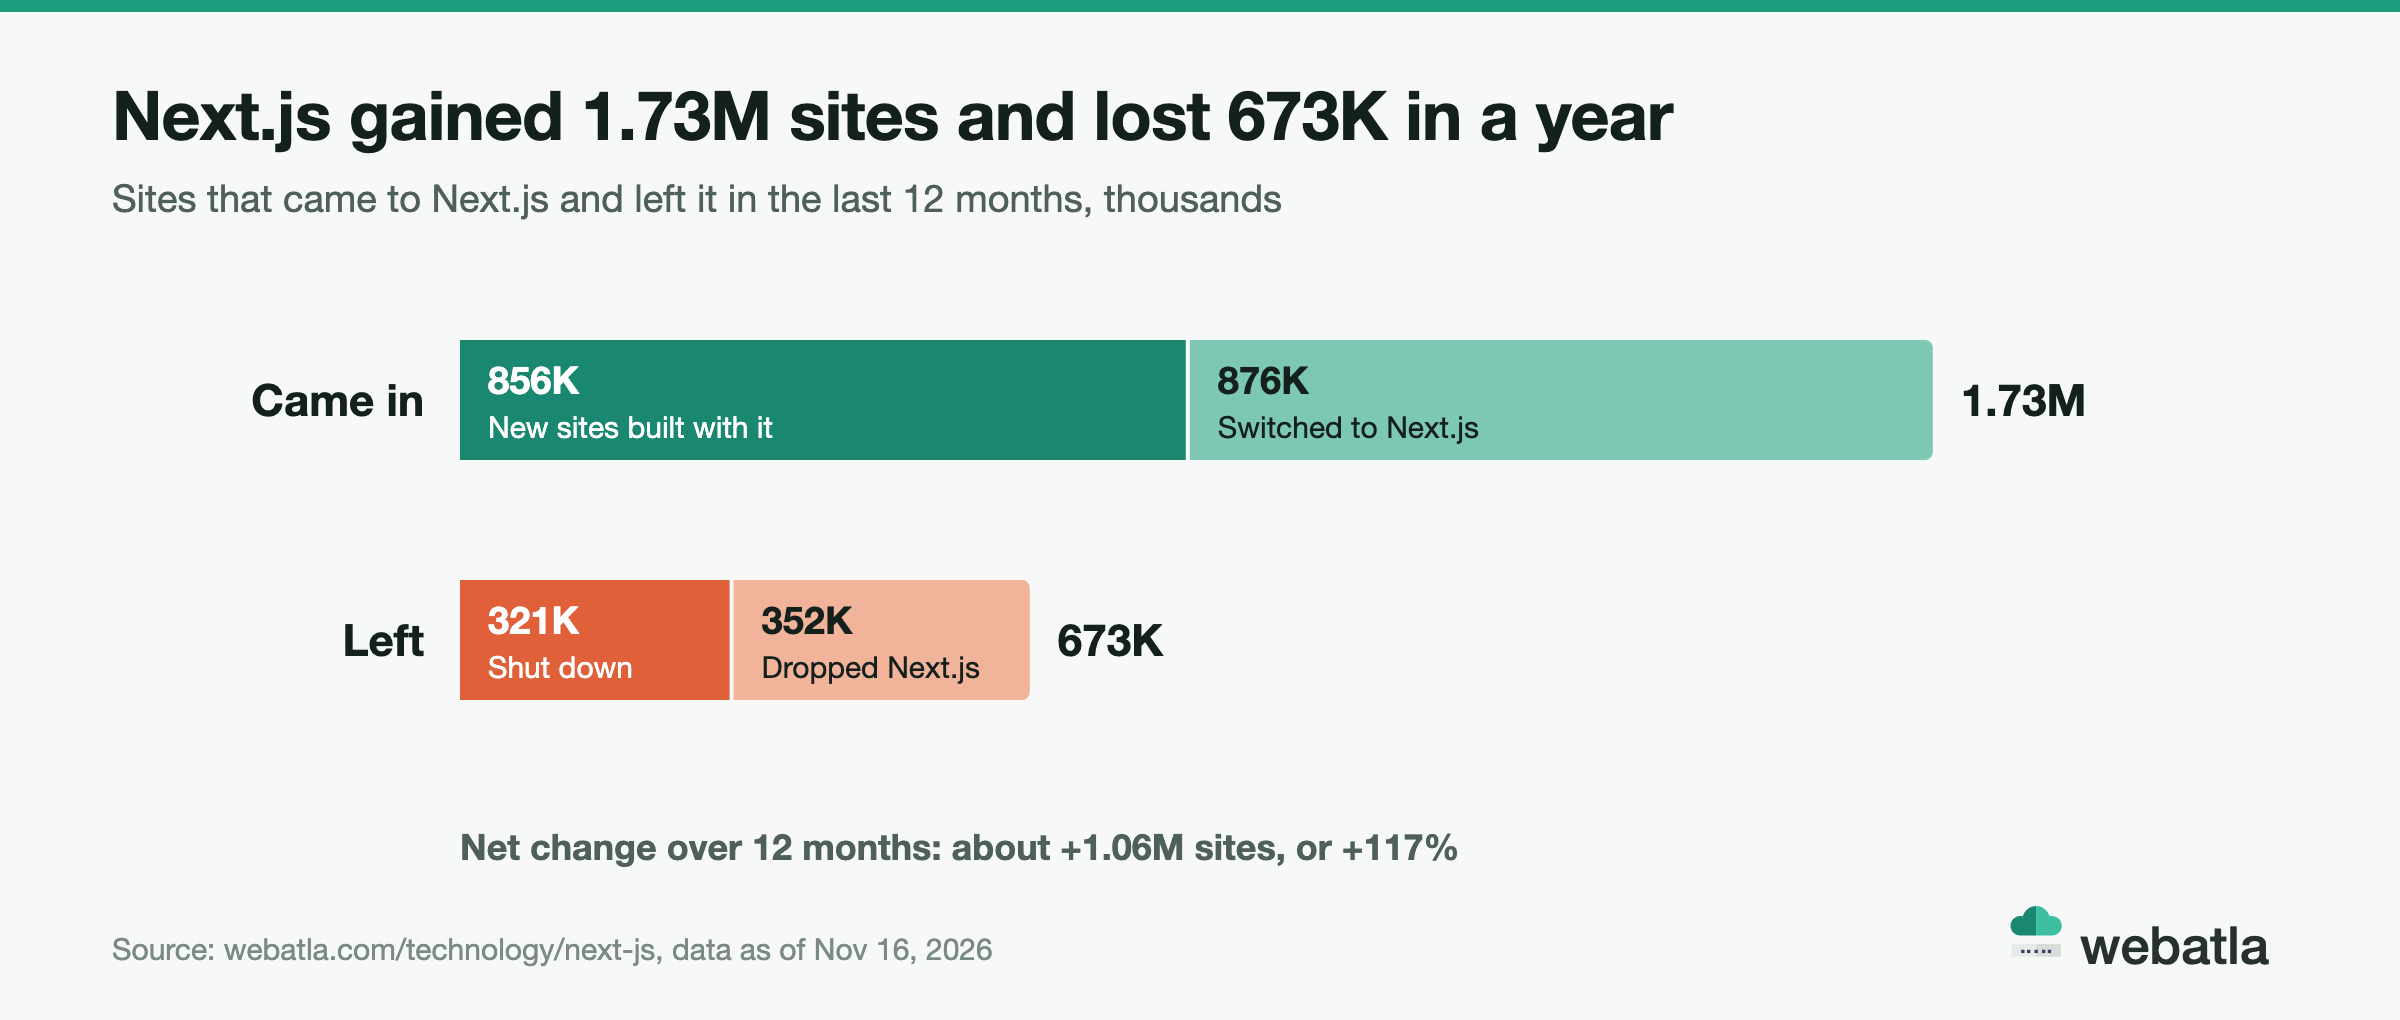
- In the last 12 months 1.73 million sites came to Next.js and 673,000 left.
- 876,000 existing sites switched to Next.js in that year, against 352,000 that dropped it. That is 2.5 arrivals for every departure.
- The model shows a net gain in every month from February 2020 to October 2026. The record month was July 2026, with +142,000 sites.
- Next.js passed Gatsby in 2021 and Nuxt.js in 2022. Today it has 3.1 times as many sites as Nuxt.js and 26.6 times as many as Gatsby.
- The Next.js count is equal to 17.9% of the React base, up from 4.4% in October 2023.
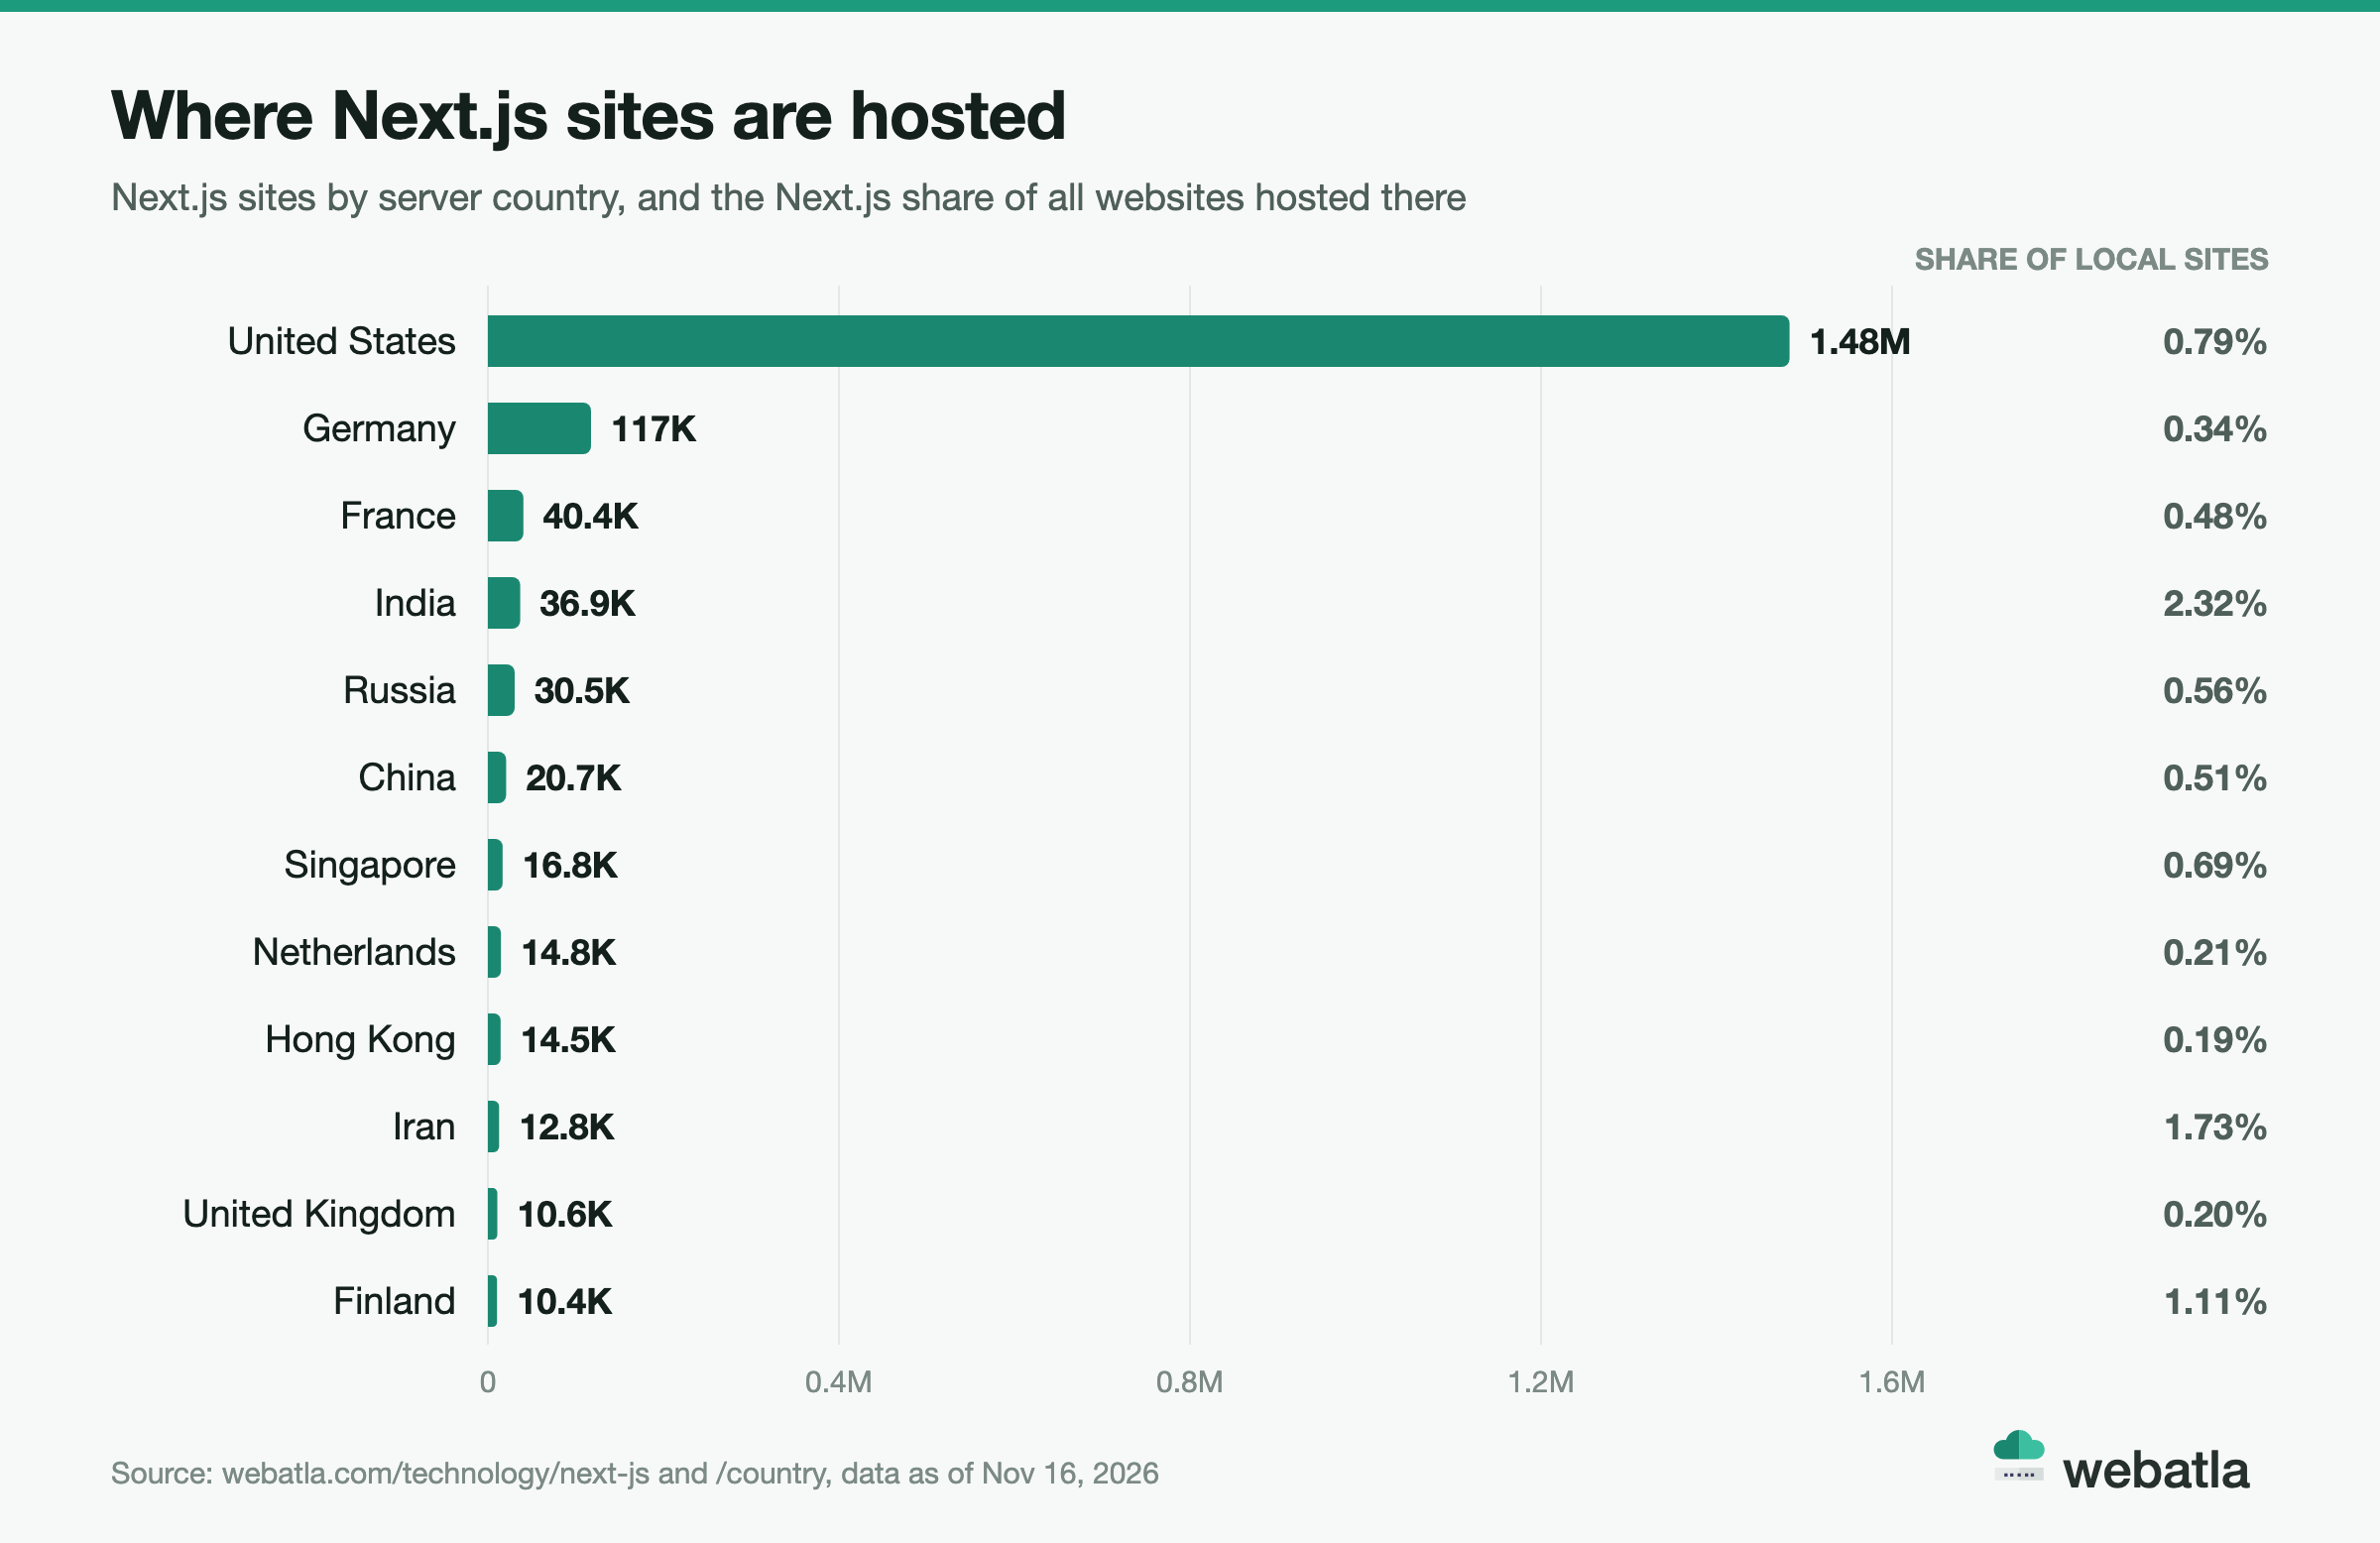
- 76.9% of Next.js sites with a known country are hosted in the United States. India has the highest Next.js share of local websites among the top hosting countries, 2.32%.
- 3.39% of all .app websites and 3.00% of all .ai websites run Next.js, about five times the web average.
Every number in this article comes from the webatla index as of November 16, 2026. webatla scans 325.8 million websites, records the technology each one runs and publishes the result as daily files. Below you will find how many websites use Next.js, how its market share compares with React, Vue.js, Nuxt.js, Astro and Gatsby, how fast the count has grown since 2018, where Next.js sites are hosted and which domain extensions they favor.
How many websites use Next.js in 2026?
Next.js runs on 1,973,502 websites as of November 16, 2026. That is every website where webatla detected Next.js in today's scan, counted one domain per site.
To get that number we look at every domain that answers with a web server, 325.8 million of them, and record the stack each one runs. Next.js leaves traces in the pages it renders and the files it serves, so a site built with it can be recognized from the outside. The count covers everything from brochure-style company sites to web applications with a public front page, since the same framework builds both.
To put 1.97 million in perspective:
- It is more sites than Netlify hosts (1,760,347).
- It is 3.1 times the Nuxt.js count and 4.0 times the Astro count.
- For every Next.js site there are about 12 WordPress sites (23,491,961).
Next.js is a different kind of technology from a CMS or a script library such as jQuery. A site built with it has a code repository, a build step and someone who deploys it. That makes 1.97 million a large number for this kind of stack.
What percentage of websites use Next.js?
0.61% of all websites run Next.js. The base here is the full web as webatla sees it: 325.8 million websites, including parked domains, placeholder pages, redirects, sites made on hosted builders and small business pages that need no framework at all.
You may see much bigger percentages quoted elsewhere. Those figures usually come from the most visited sites only, where custom-built front ends are far more common than in the long tail of the web.
webatla can show several views from the same data:
| Base | Websites | Next.js |
|---|---|---|
| All websites webatla tracks | 325,803,430 | 0.61% share |
| Sites on the 20 site frameworks and static site generators | 3,485,397 | 56.6% share |
| Websites that run React | 11,053,868 | equal to 17.9% |
So the answer depends on the question. Out of every website online, about 1 in 165 runs Next.js. Out of every site built with a dedicated site framework or static site generator, more than half use Next.js.
Next.js market share vs other JavaScript frameworks
Next.js is the third largest name in webatla's JavaScript frameworks category. React leads with 11.05 million sites. Vue.js is second with 2.06 million, and Next.js follows close behind with 1.97 million.
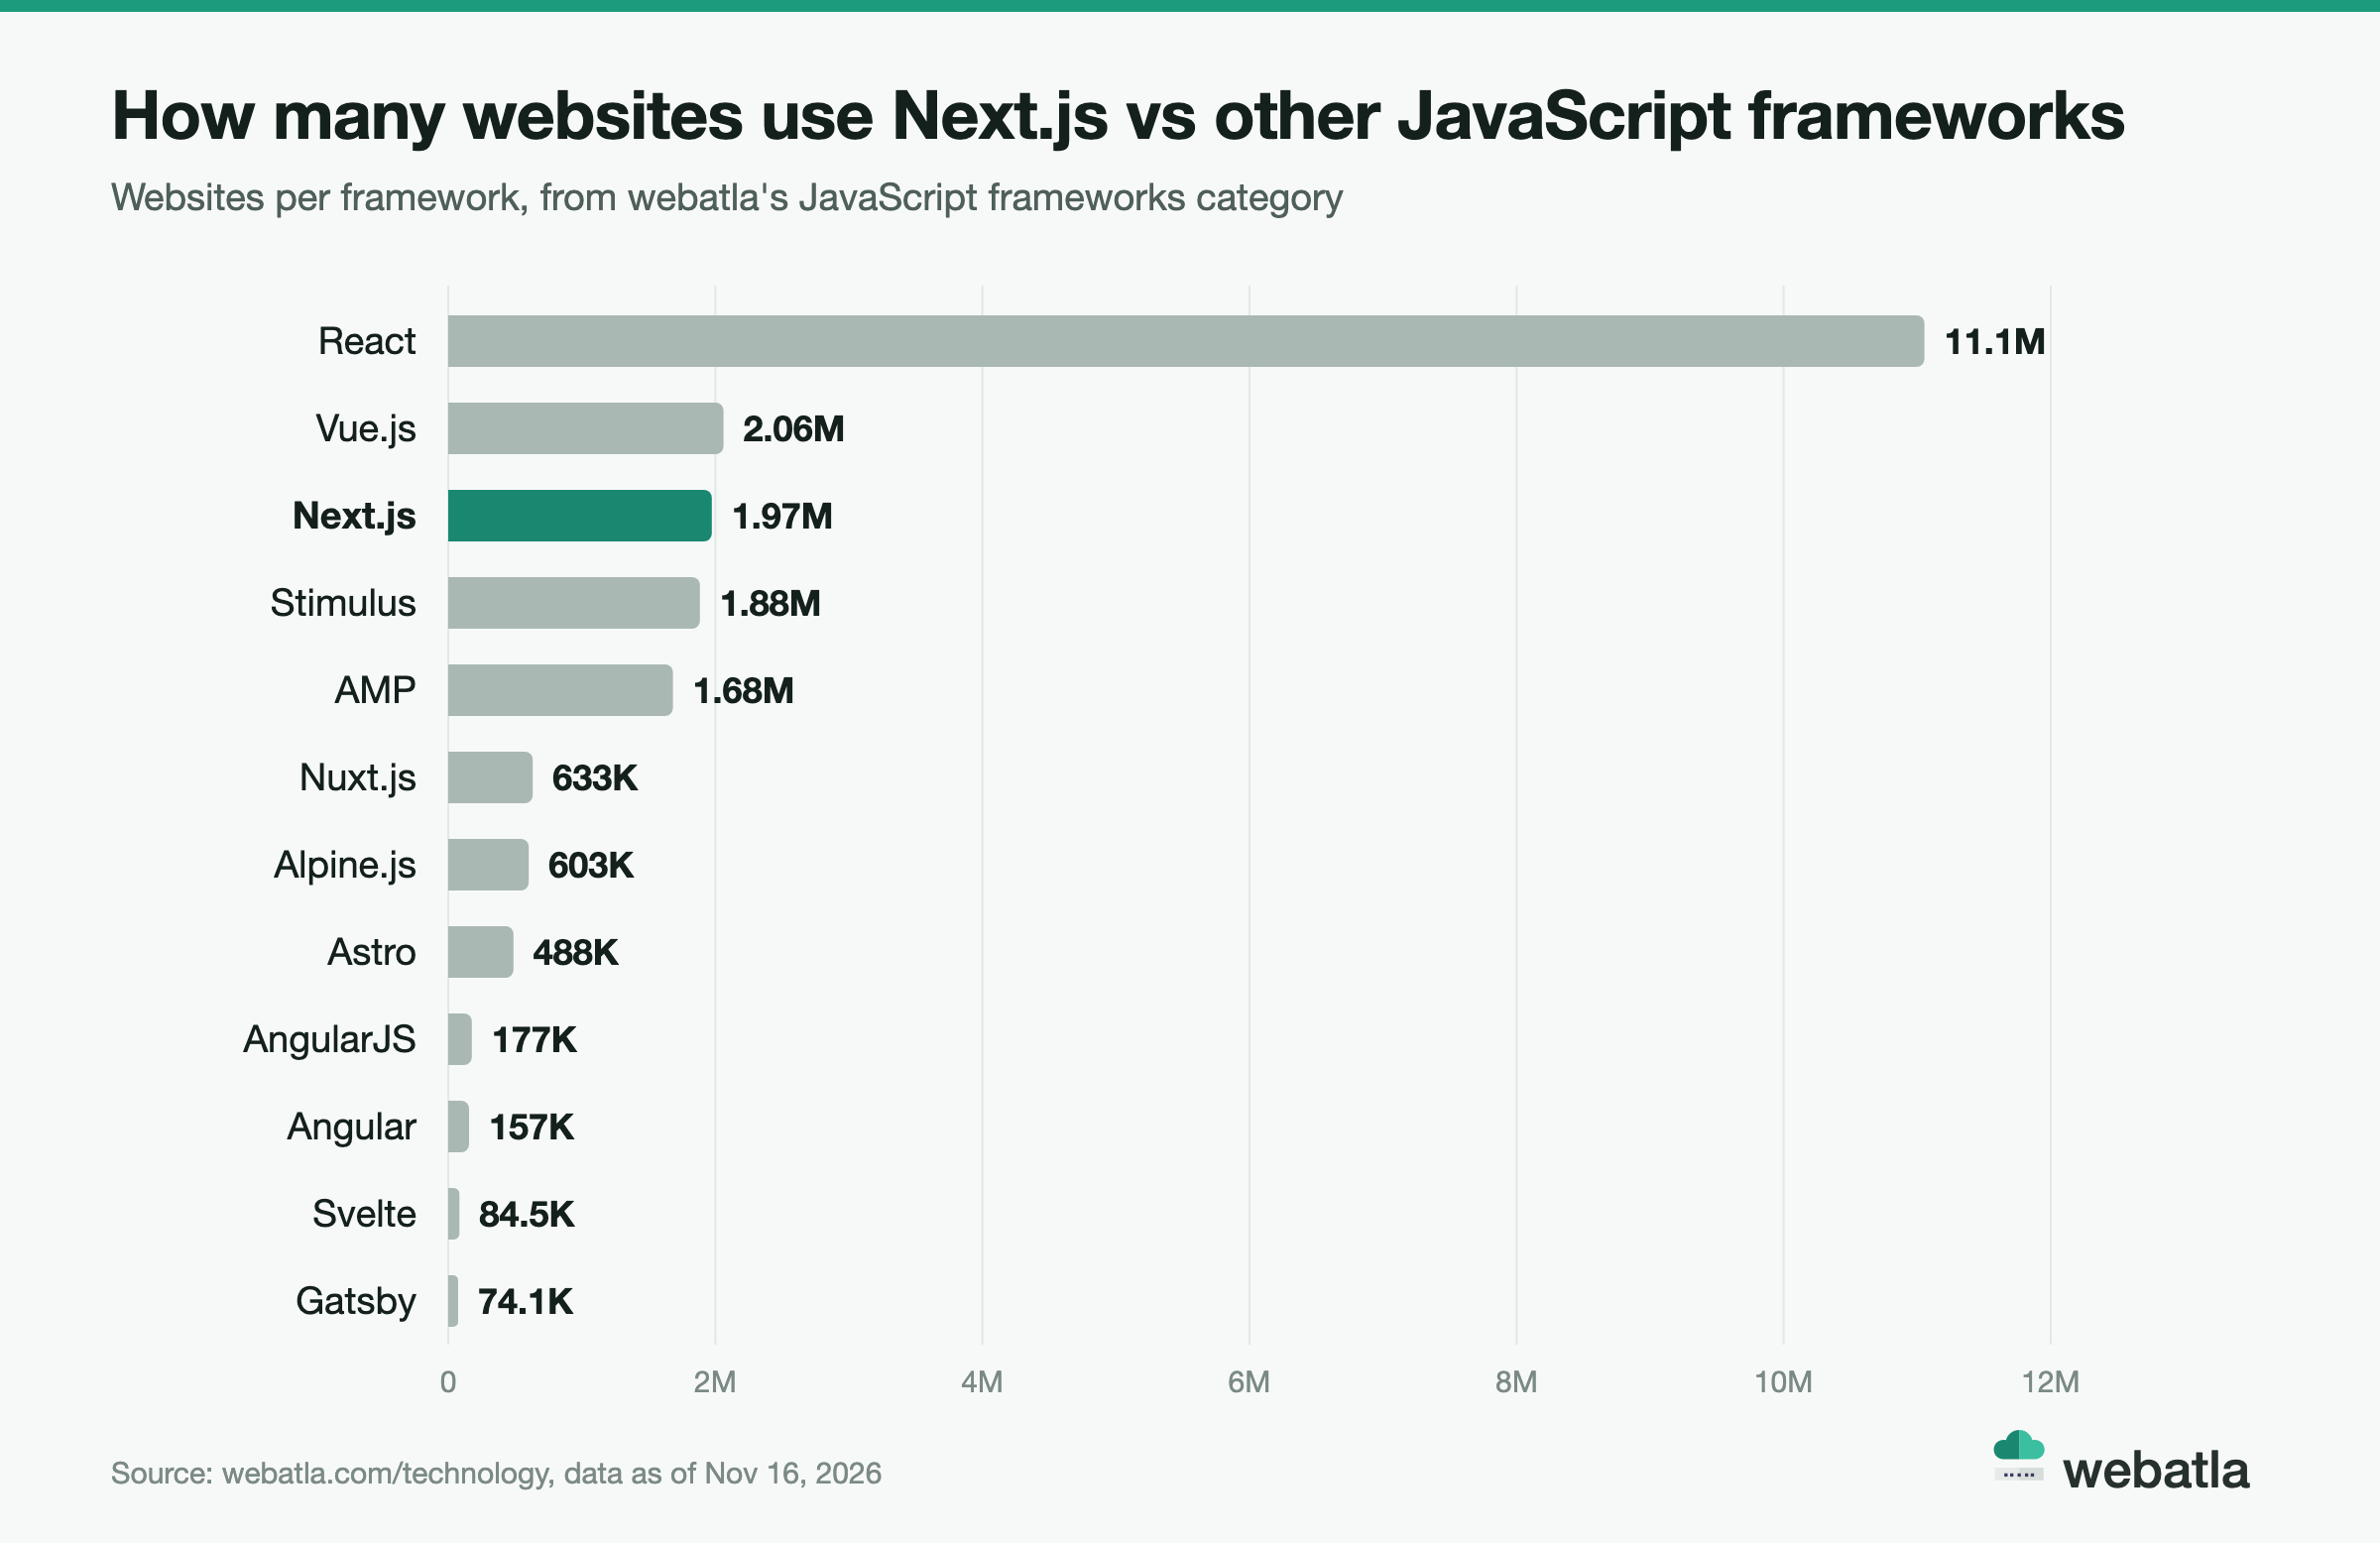
| Framework | Websites | Share of all websites | Change, Oct 2023 to Oct 2026 |
|---|---|---|---|
| React | 11,053,868 | 3.39% | +35% |
| Vue.js | 2,061,594 | 0.63% | +81% |
| Next.js | 1,973,502 | 0.61% | +448% |
| Stimulus | 1,884,551 | 0.58% | +322% |
| AMP | 1,682,144 | 0.52% | +96% |
| Nuxt.js | 633,307 | 0.19% | +155% |
| Alpine.js | 603,461 | 0.19% | +146% |
| Astro | 487,995 | 0.15% | 14x |
| AngularJS | 176,523 | 0.05% | -48% |
| Angular | 156,514 | 0.05% | +59% |
| Svelte | 84,502 | 0.03% | +207% |
| Gatsby | 74,110 | 0.02% | -29% |
These frameworks do different jobs, so a single market share across all of them would mix things that do not compete. A cleaner peer group is the one Next.js shares with Nuxt.js, Astro, Hugo, Jekyll and Gatsby: tools that build whole websites. webatla files 20 technologies under Static site generator, Next.js among them, and together they run on 3,485,397 sites.
Three things stand out in the market share data.
Next.js has more than half of the site framework market. Its 56.6% share is three times the 18.2% of Nuxt.js, the second name. Astro holds 14.0% and Hugo 5.3%. The other 16 tools share the remaining 5.9%.
Vue.js is within reach. Today's files show Vue.js at 2,061,594 sites and Next.js at 1,973,502. In 2026 Vue.js gained a net 64,800 sites from January to October, while Next.js gained 965,000. If the 2026 pace holds, Next.js is likely to pass Vue.js within months and become the second largest framework webatla detects.
The older generation is shrinking. AngularJS lost 48% of its sites in three years and Gatsby lost 29%. Jekyll is flat at -2.4%. Among the tools that build whole sites, the gains went to Next.js, Astro and Nuxt.js.
Next.js growth statistics: 2018 to 2026
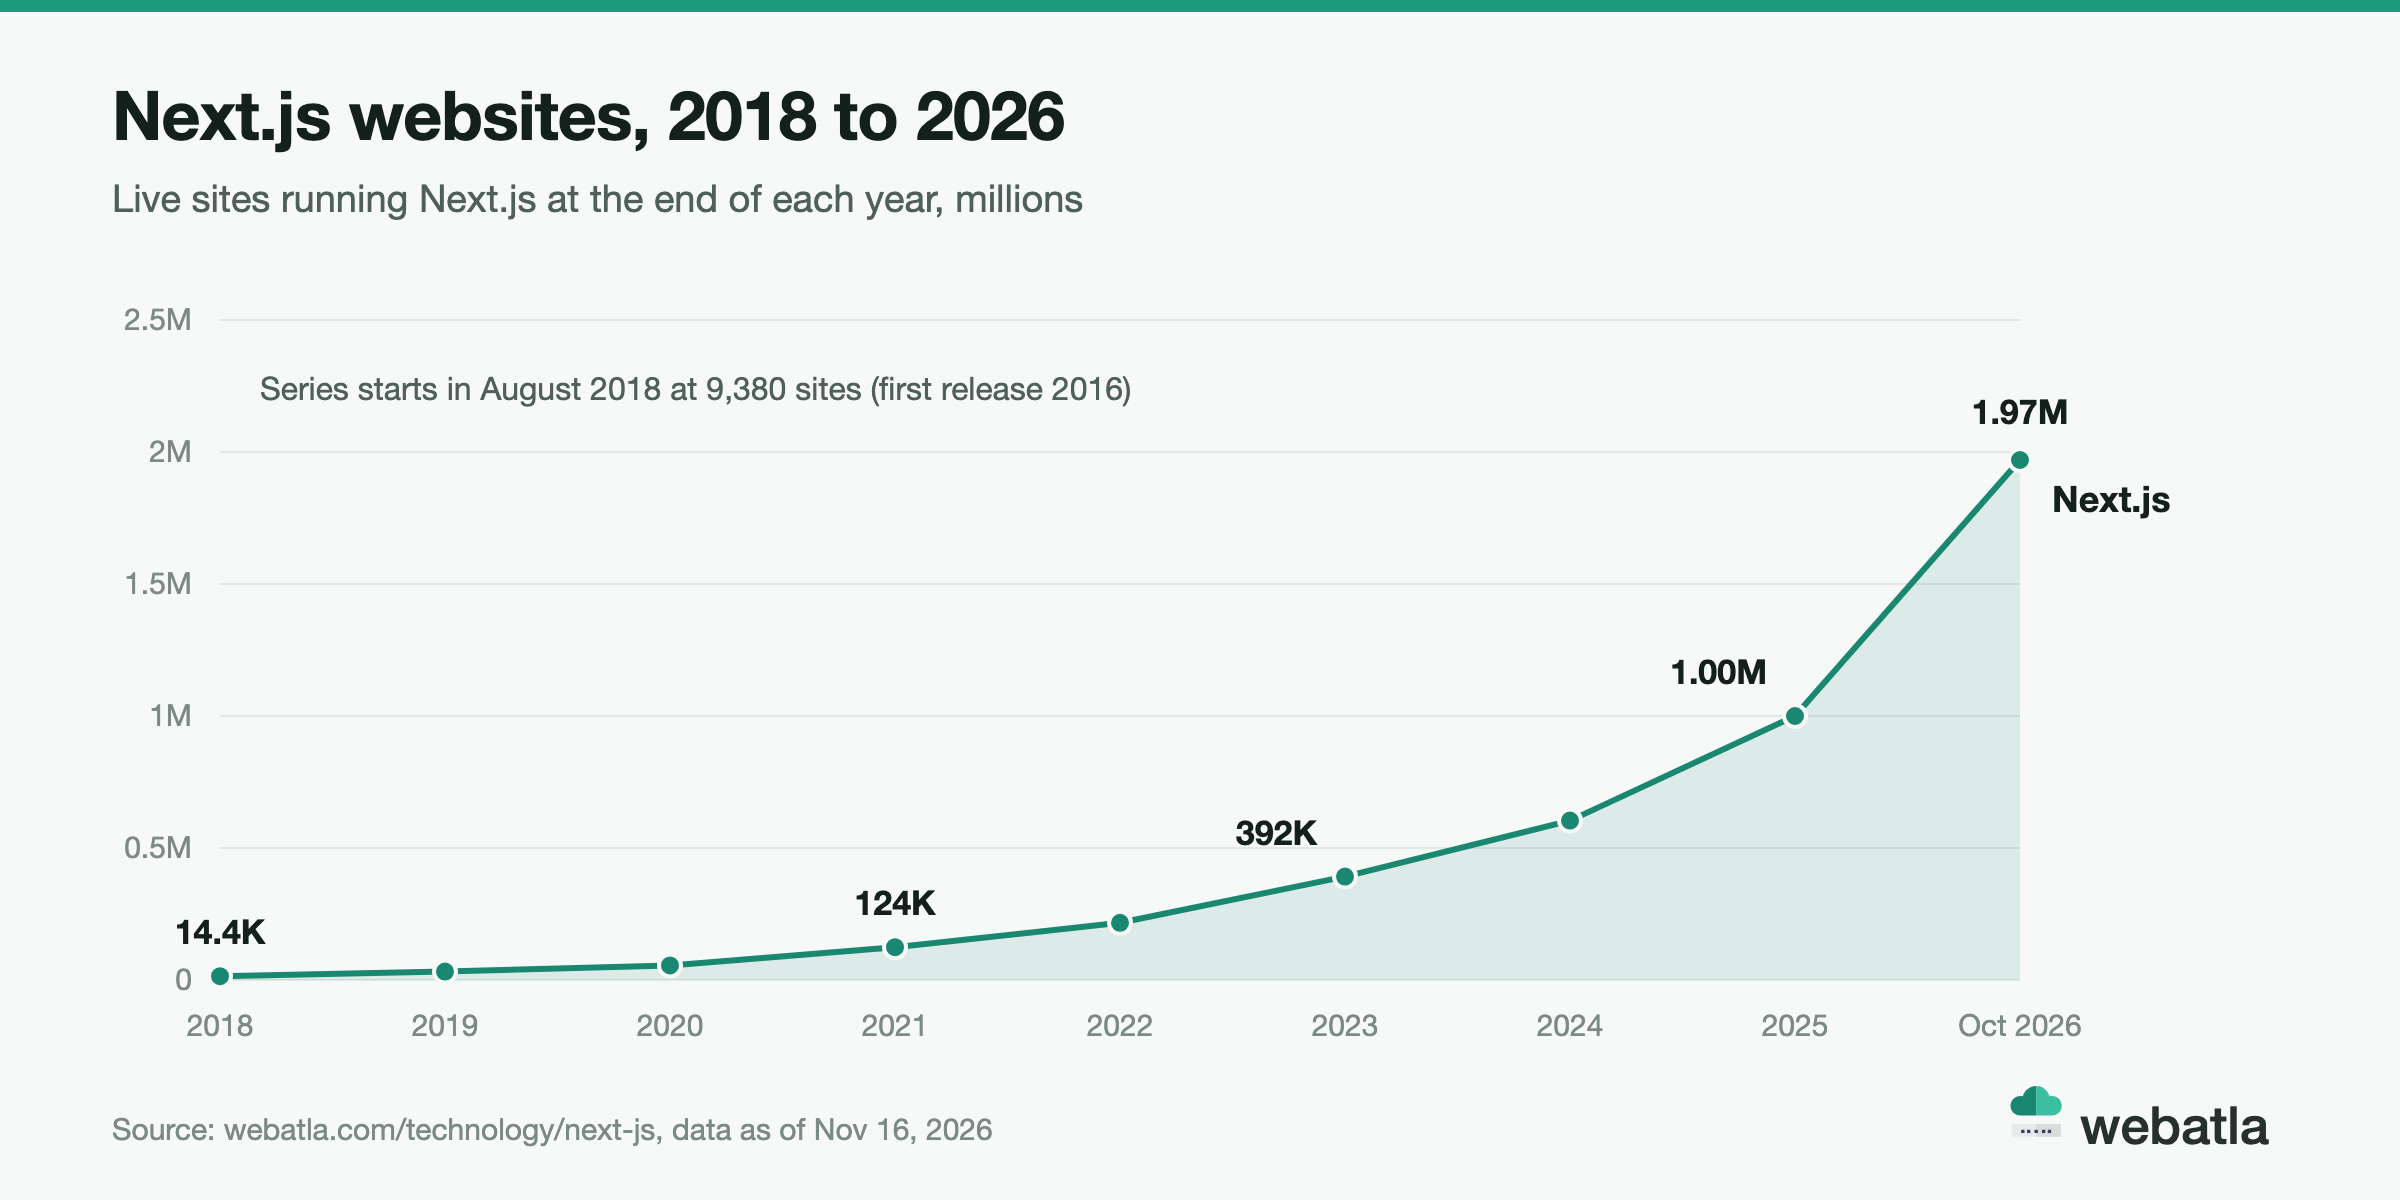
webatla's history for Next.js starts in August 2018 with 9,380 sites. The framework's first release was in 2016, according to its technology page, so the series misses the first two years. Nothing in the line predates the release, and the count is already large enough by 2018 to read the trend.
| Year | Next.js sites at year end | Came in | Left | Net change | Growth in the year |
|---|---|---|---|---|---|
| 2018, August to December | 14.4K | 7.13K | 2.12K | +5.01K | |
| 2019 | 31.8K | 33.8K | 16.3K | +17.4K | +121% |
| 2020 | 55.4K | 43.9K | 20.3K | +23.6K | +74% |
| 2021 | 124K | 91.9K | 23.1K | +68.8K | +124% |
| 2022 | 217K | 134K | 40.6K | +93.2K | +75% |
| 2023 | 392K | 235K | 60.3K | +175K | +81% |
| 2024 | 604K | 361K | 148K | +212K | +54% |
| 2025 | 1.00M | 725K | 330K | +396K | +66% |
| 2026, January to October | 1.97M | 1.57M | 602K | +965K | +97% |
From the end of 2018 to October 2026 the count grew about 137 times. The table shows three phases.
2019 to 2021: doubling from a small base. Next.js more than doubled in 2019 and again in 2021. The only losing months in the whole series came in this phase. In December 2019 and January 2020 the count fell by a combined 4,910 sites, and almost all of that came from sites that stayed online but stopped showing Next.js: 10,250 in two months, against roughly 550 to 1,300 a month earlier in 2019. The count was back above its November 2019 level by May 2020.
2022 to 2024: steady compounding. Growth settled between +54% and +81% a year. The net gain rose every year, from 93,200 sites in 2022 to 212,000 in 2024.
2025 and 2026: the curve steepens. Next.js crossed one million sites at the end of 2025 and almost doubled again in the first ten months of 2026. The net gain of 965,000 sites from January to October 2026 is more than the whole count at the end of 2024.
Look at where the new sites come from. In 2023 and 2024 more existing sites switched to Next.js (132,000 and 200,000) than launched with it (103,000 and 161,000). In 2025 new sites led, 382,000 against 343,000. In 2026 so far the two are close again: 798,000 switched and 769,000 started fresh. Existing sites switching over carry as much of the growth as new launches.
Is Next.js growing or declining?
Next.js is growing fast. It changed by +448% from October 2023 to October 2026 and by +117% over the last 12 months. Among the frameworks in this article only Astro, from a much smaller base, grew faster in percentage terms.
Over the last 12 months:
- 856,000 new sites started on Next.js. These are fresh websites that launched with it, about 2,345 a day.
- 876,000 existing sites switched to Next.js from another stack, about 2,400 a day.
- 321,000 Next.js sites shut down. The domain expired or the site went offline.
- 352,000 sites dropped Next.js and moved to something else while staying online.
Two ratios sum it up. For every Next.js site that shut down, 2.7 new ones launched. For every site that dropped Next.js, 2.5 switched to it. Next.js wins on both fronts, with new launches and with switches. In total about 4,740 sites a day came to Next.js over the year.
The losses are not small either. 673,000 sites left Next.js in 12 months, which shows how much a fast-growing list changes inside. A file from a year ago misses most of the 1.73 million sites that came in since and still contains hundreds of thousands that have left.
2026 was the fastest year so far
The monthly data shows how sharply the pace changed.
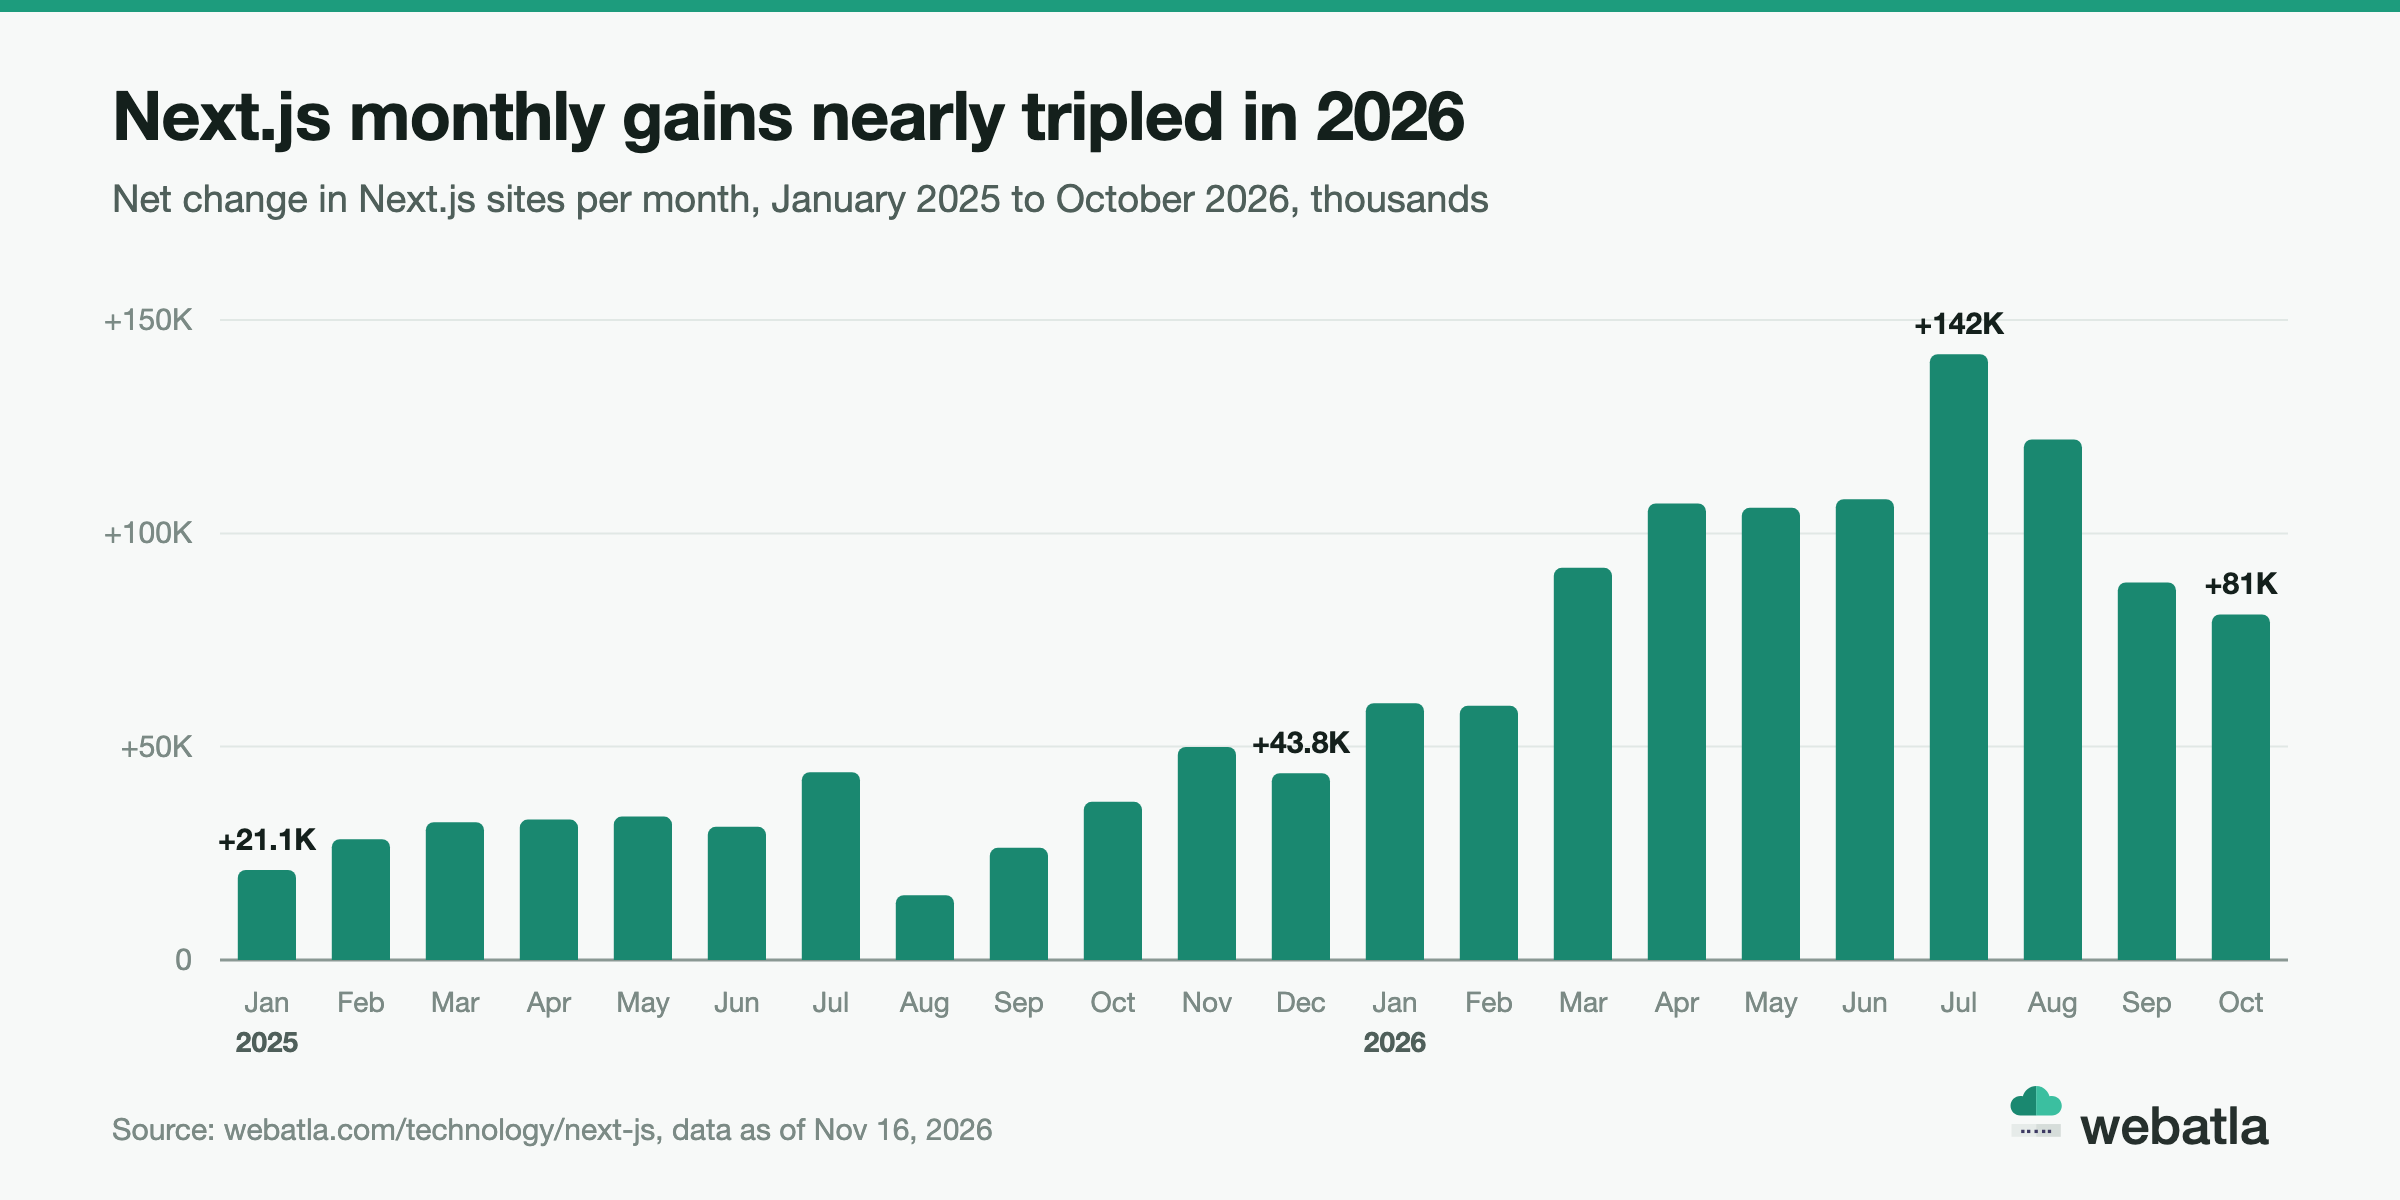
In 2025 Next.js added between 15,200 and 49,900 sites a month, about 33,000 on average. January and February 2026 brought about 60,000 each. From March the pace jumped: 91,900 in March, 107,000 in April and a record 142,000 in July. Since then the monthly gain has eased to 122,000 in August, 88,500 in September and 81,000 in October. That is still more than any month before March 2026. The 2026 average, about 96,500 a month, is nearly three times the 2025 pace.
There is no clear seasonal pattern. The weakest month of 2025 was August, but August 2026 was the second strongest month on record.
The 2026 jump is not unique to Next.js. In the same ten months Vercel went from 2.14 million to 5.01 million sites, Netlify from 966,000 to 1.73 million and Astro from 147,000 to 476,000. Vue.js, by contrast, added a net 64,800 sites. That is a sign that the 2026 jump comes from a wider wave of new and rebuilt sites on these deployment platforms, with Next.js as one of the frameworks behind it.
Next.js vs Nuxt.js, Gatsby and Astro
Next.js did not always lead the site framework market. At the end of 2018 the three were almost level: Next.js had 14,400 sites, Nuxt.js 16,100 and Gatsby 16,600.
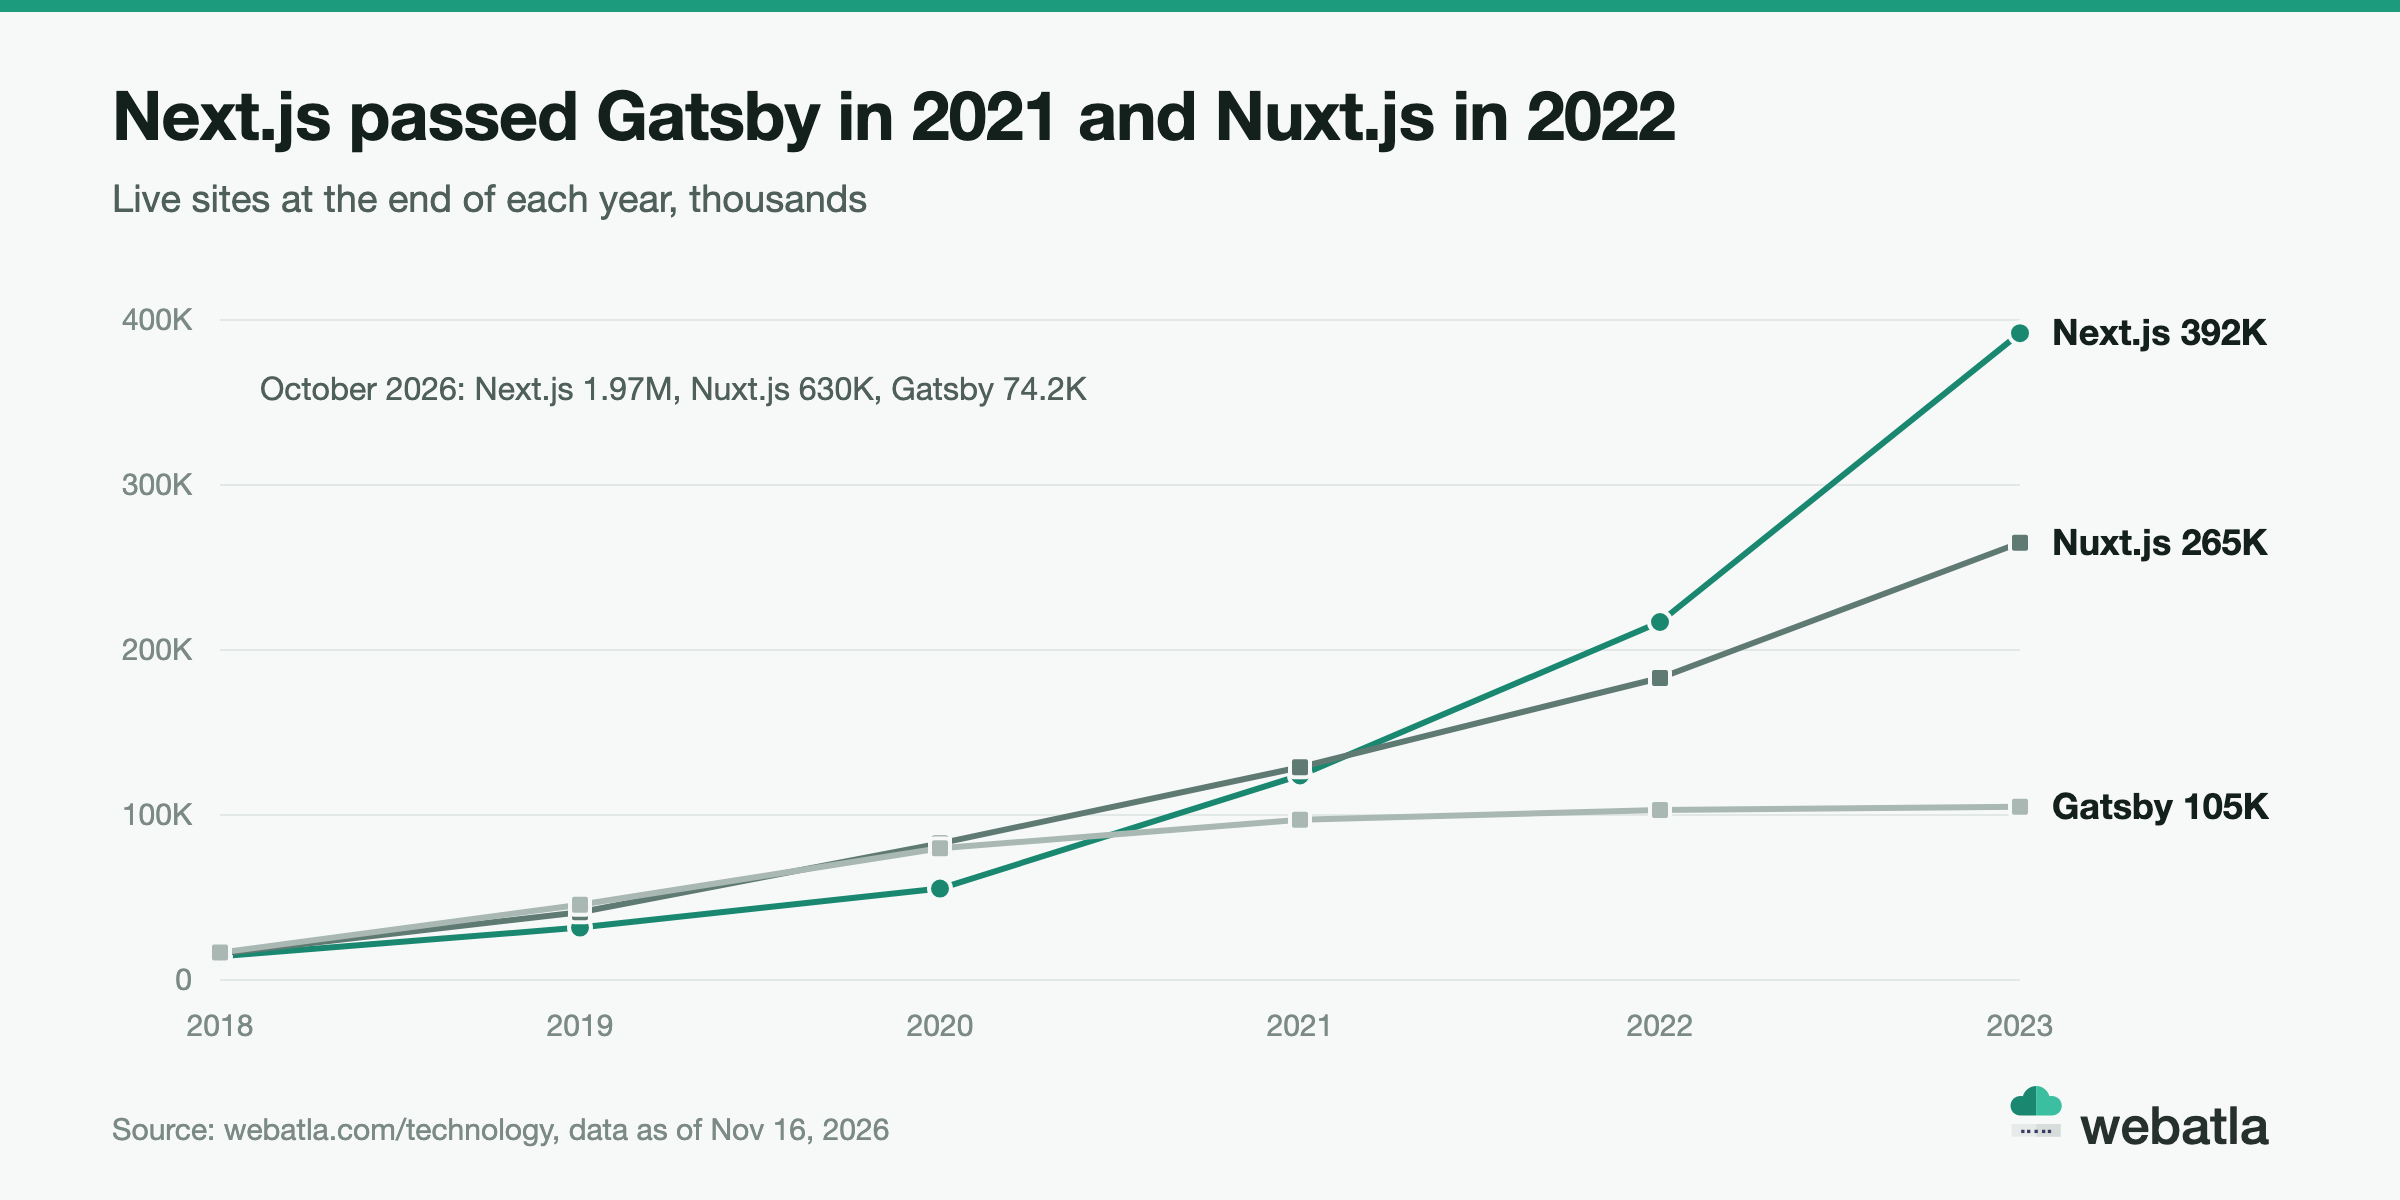
Next.js vs Gatsby. Gatsby was ahead for the first three years. In July 2021 it still had 91,700 sites against 89,400 for Next.js. By September 2021 Next.js led with 99,600 against 93,800, and the gap has only grown since. Gatsby peaked at 105,000 sites at the end of 2023 and has been shrinking since. In the last 12 months 10,200 sites came to Gatsby and 23,600 left. Next.js now has 26.6 times as many sites.
Next.js vs Nuxt.js. Nuxt.js is the closest match to Next.js. Its technology page describes the same job, a framework that wraps a component library with routing, rendering and data loading. It led Next.js until early 2022. In January 2022 Nuxt.js had 134,000 sites and Next.js 131,000. By May 2022 Next.js was ahead, 164,000 to 150,000. Nuxt.js is still growing, +155% in three years and +24% in the last 12 months, but Next.js grows faster and now has 3.1 times as many sites.
Next.js vs Astro. Astro is the youngest name here, first released in 2021, and the fastest growing in percentage terms. It grew 14 times from October 2023 to October 2026 and +260% in the last 12 months, to 487,995 sites. In absolute numbers Next.js still adds far more: about 1.61 million sites over three years against about 441,000 for Astro.
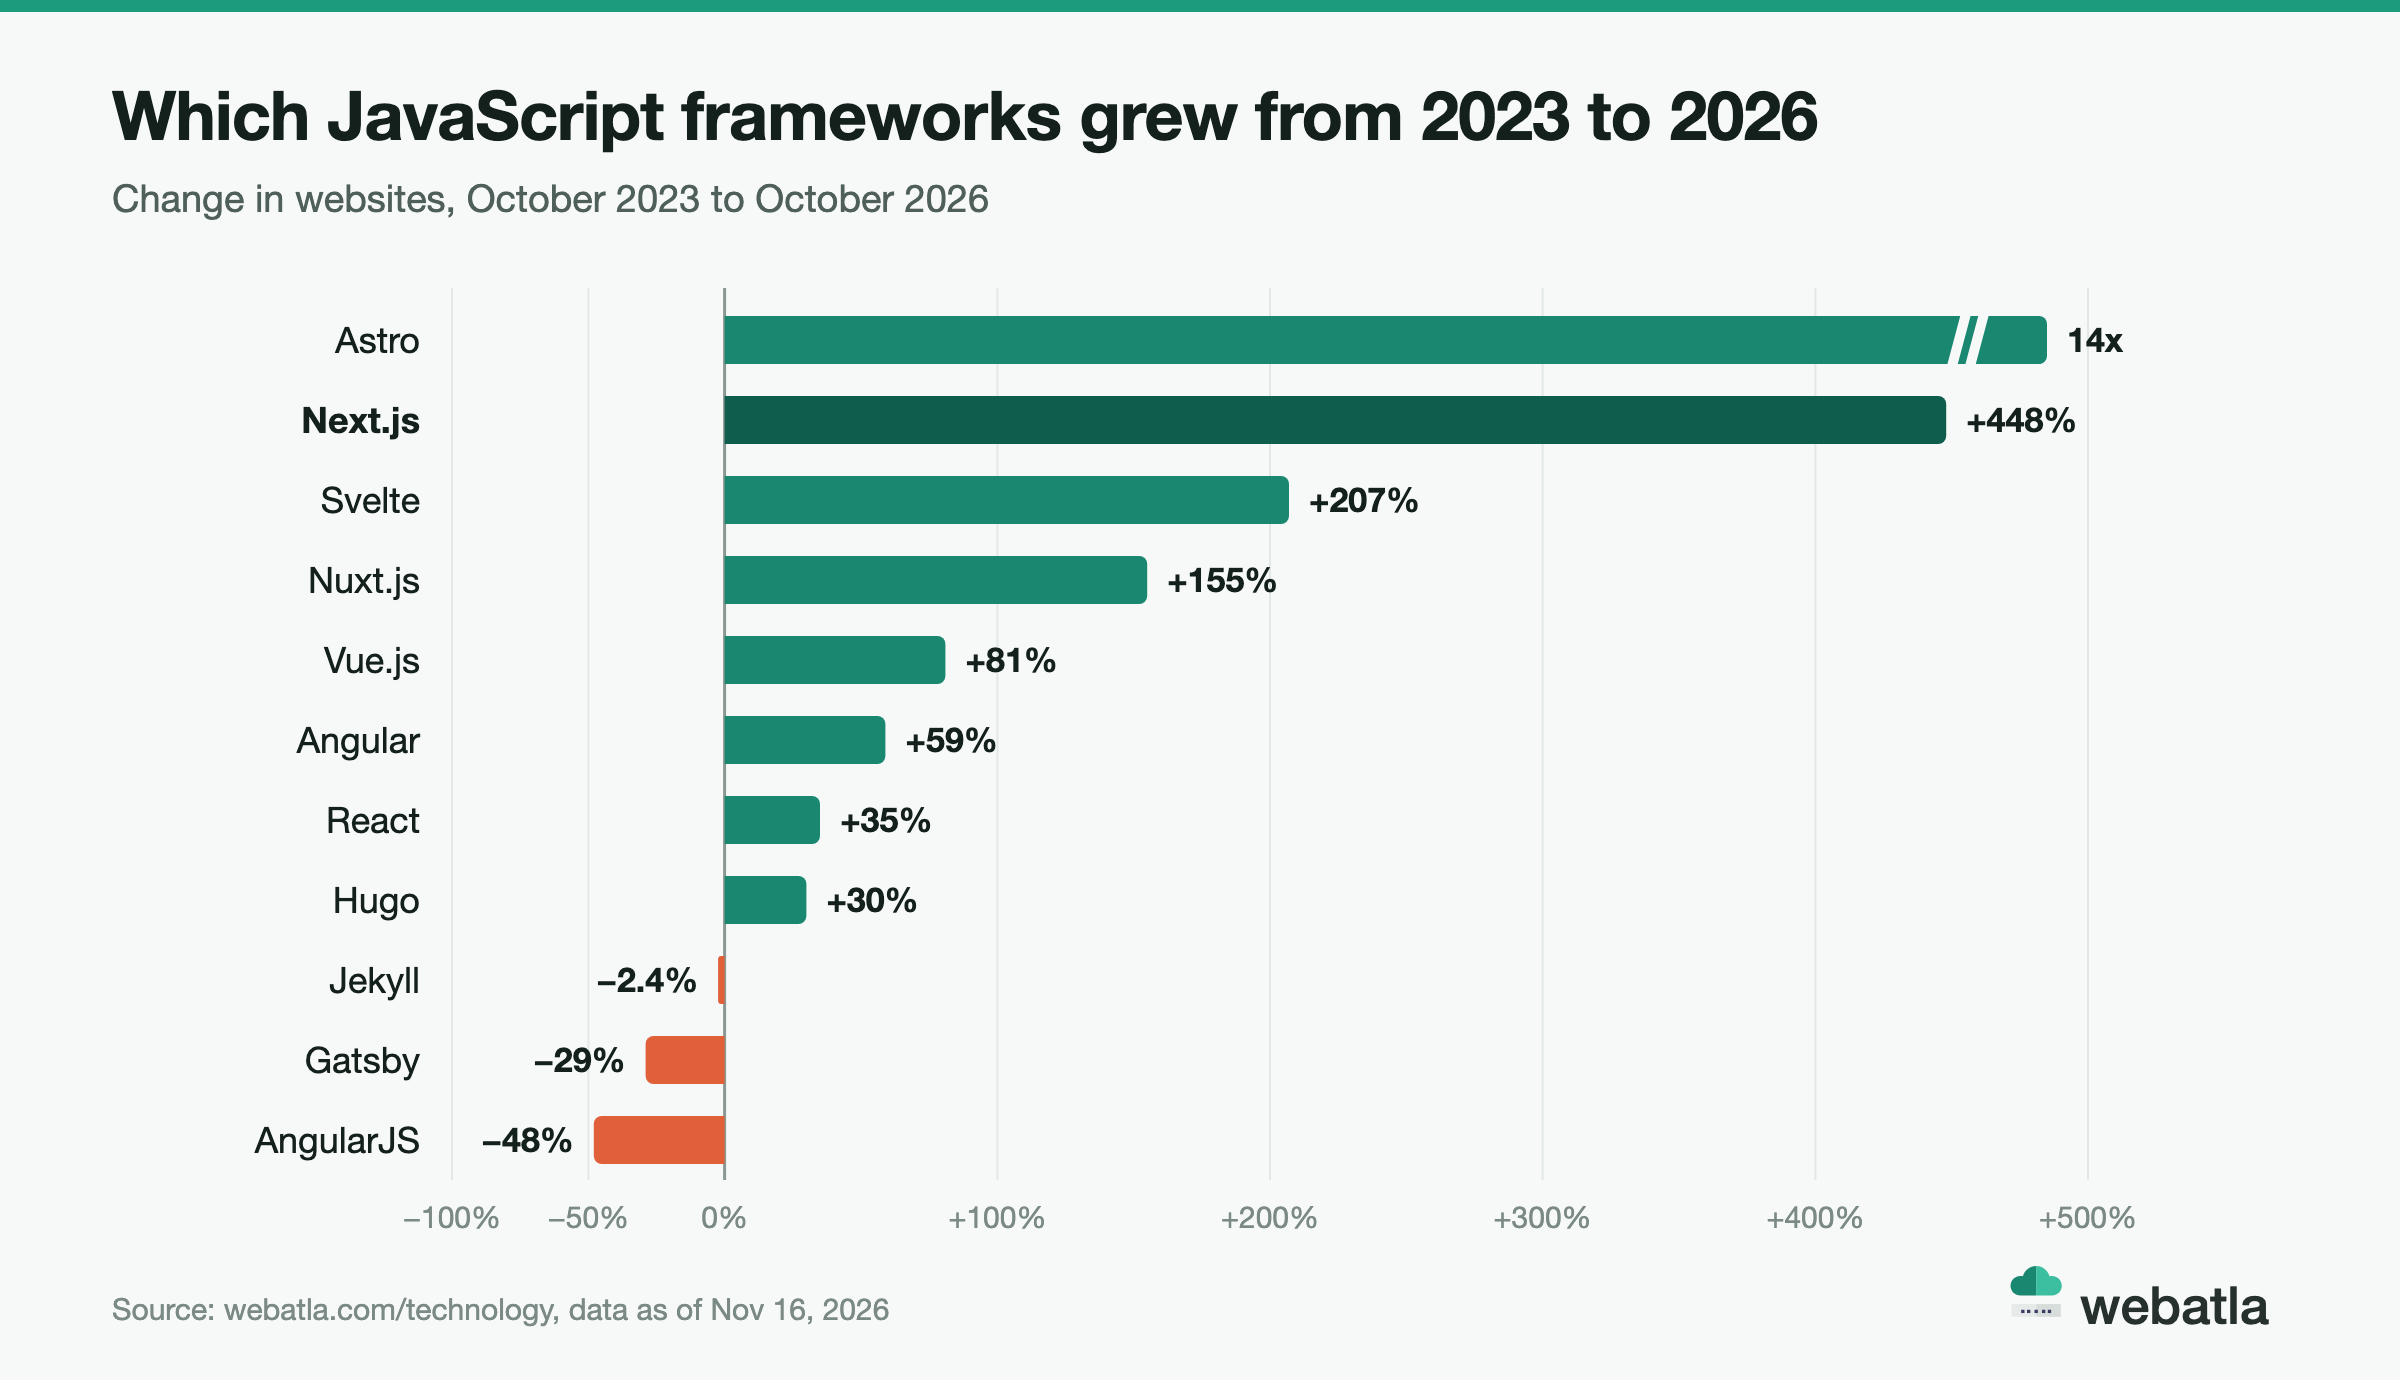
Percentages favor small bases, so here are the same three years in sites:
| Framework | Sites, Oct 2023 | Sites, Oct 2026 | Net change | Change |
|---|---|---|---|---|
| React | 8.20M | 11.1M | about +2.9M | +35% |
| Next.js | 359K | 1.97M | about +1.61M | +448% |
| Vue.js | 1.15M | 2.07M | about +920K | +81% |
| Astro | 34.8K | 476K | about +441K | 14x |
| Nuxt.js | 247K | 630K | about +383K | +155% |
| Svelte | 27.3K | 83.7K | about +56K | +207% |
| Angular | 91K | 144K | about +53K | +59% |
| Gatsby | 104K | 74.2K | about -30K | -29% |
| AngularJS | 345K | 178K | about -167K | -48% |
Of these frameworks, only React added more sites than Next.js in the last three years. Next.js gained more than Vue.js and Nuxt.js combined.
Next.js and React
Next.js wraps a component library with server rendering, routing and a build system, and in webatla's sample rows that library is React. So the two counts belong together.
React runs on 11,053,868 websites. The Next.js count is equal to 17.9% of that base, about one in 5.6. Three years ago the ratio was very different. In October 2023 the model shows 8.20 million React sites and 359,000 Next.js sites, so Next.js was equal to 4.4% of the React base. By October 2026 it was 17.7%.
React grew by +35% over those three years and Next.js by +448%. A rising share of the React web now comes with a full framework around it, a sign that teams starting a React project more and more often start it with Next.js.
Next.js hosting: Vercel, Netlify and Node.js
Next.js is maintained by Vercel, and the hosting platforms aimed at front-end teams grew together with it.
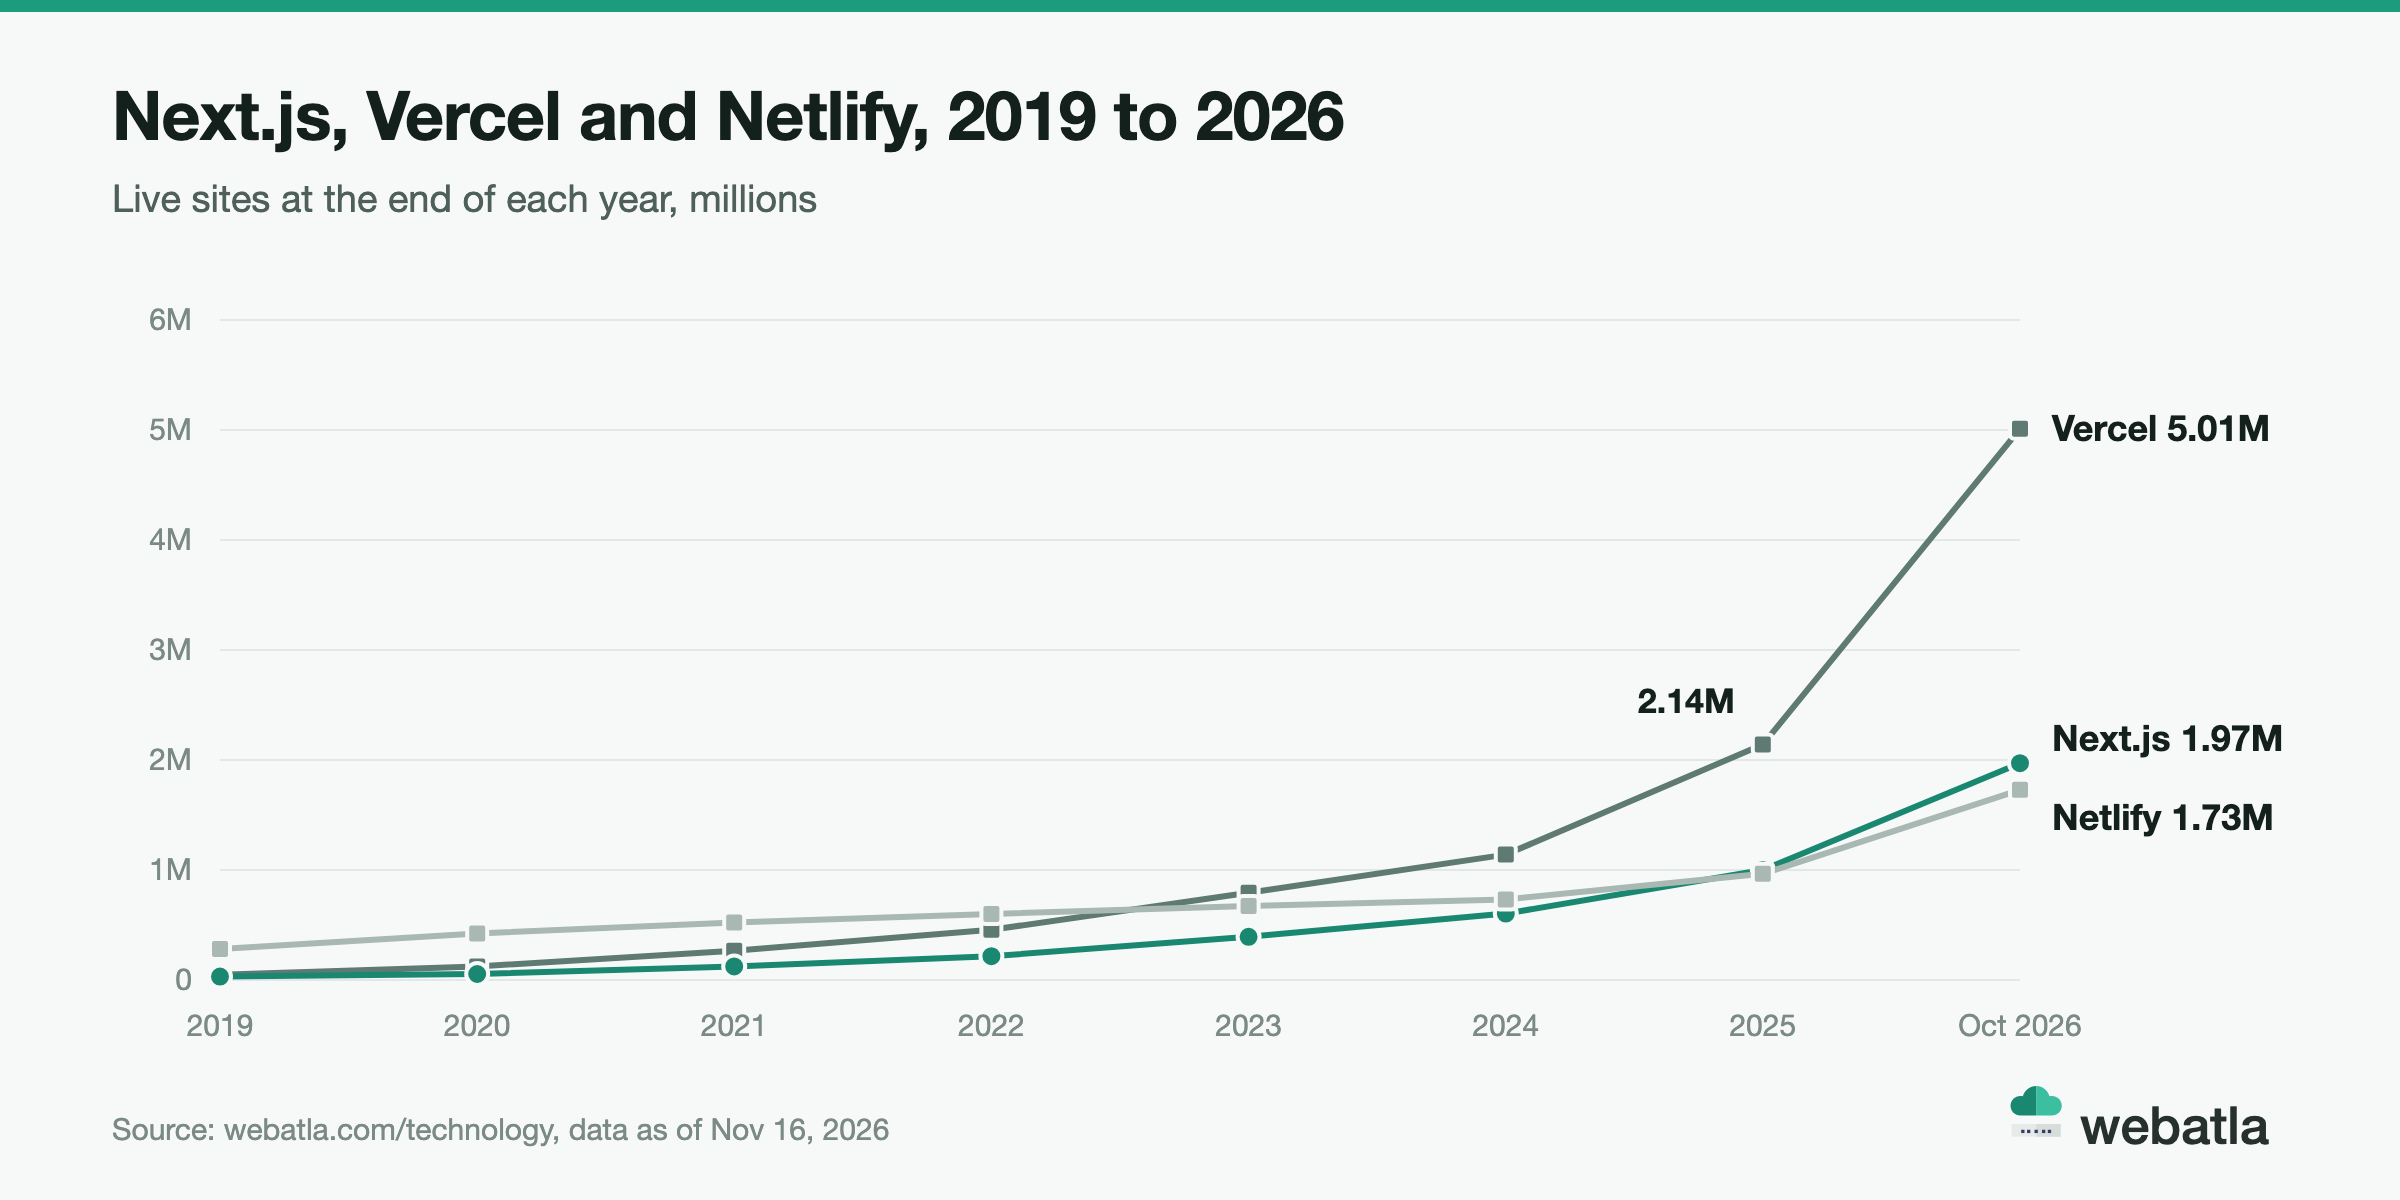
- Vercel hosts 5,083,343 websites, up 580% in three years and 165% in the last 12 months. In those 12 months 4.21 million sites came in and 1.1 million left. The Next.js count is equal to 38.8% of the Vercel base.
- Netlify hosts 1,760,347 websites, up 163% in three years and 90% in the last 12 months. Next.js passed the Netlify count in November 2025, with 956,000 sites against 932,000.
- Node.js runs on 3,863,899 websites, up 178%. Express, a JavaScript web framework, runs on 932,791, up 104%.
- Webpack shows up on 2,703,113 websites.
These are separate counts. A Next.js site can run on Vercel, Netlify, a cloud server or behind a CDN, and the webatla file lists all of them on the same row when a site runs several. That makes the overlap a single filter rather than a guess.
Hosting probably explains much of the country data below. Vercel's own page shows 98.8% of its sites with a known country served from the United States. When a framework grows together with a platform that serves from one country, much of its footprint can end up in that country.
Next.js version statistics
Next.js version statistics need a warning before any number. Almost no Next.js site exposes its version. Out of 1,973,502 sites, only about 750 show one, 0.04% of the total.
The technology page explains why. A version is readable only when the build leaves a fingerprint behind, and newer releases and newer hosting defaults remove it. The versions webatla can read lean toward old and openly configured deployments.
With that caveat, the readable values look like this:
- 7.0.2 is the most common exact version, on 139 sites, 18.6% of the readable values. 7.0.3 follows with 100.
- Major-only values 15, 14 and 13 appear on 72, 68 and 65 sites. Version 16 appears on 2.
- webatla tracks 34 distinct Next.js versions in all.
So the version field works as a floor for old releases rather than a census. The full 1.97 million sites are in the count whatever version they run. If you need to know which sites run an old release, the readable rows are a short, very specific list.
Next.js usage by country
Country here means where the site's server is, by IP address, not where the owner lives. For a framework that is often deployed on global platforms, this matters a lot.
| Hosting country | Next.js sites | Share of Next.js sites | Next.js share of local websites |
|---|---|---|---|
| United States | 1,483,166 | 76.9% | 0.79% |
| Germany | 117,415 | 6.1% | 0.34% |
| France | 40,423 | 2.1% | 0.48% |
| India | 36,942 | 1.9% | 2.32% |
| Russia | 30,549 | 1.6% | 0.56% |
| China | 20,724 | 1.1% | 0.51% |
| Singapore | 16,833 | 0.9% | 0.69% |
| Netherlands | 14,838 | 0.8% | 0.21% |
| Hong Kong | 14,541 | 0.8% | 0.19% |
| Iran | 12,820 | 0.7% | 1.73% |
| United Kingdom | 10,632 | 0.6% | 0.20% |
| Finland | 10,408 | 0.5% | 1.11% |
The United States hosts 76.9% of Next.js sites with a known country, 1,483,166 of them. That is a much heavier US share than the web as a whole, where US servers host 57.4% of all websites. A large part of it most likely reflects platform hosting, since Vercel serves almost all of its sites from US infrastructure. Germany is second with 117,415 sites. Netlify's page shows 45.4% of its sites served from Germany, so platform hosting is probably part of that number too.
The last column shows how common Next.js is among all websites hosted in each country. Here the order changes. India has the highest share among the top hosting countries: 2.32% of websites hosted there run Next.js, nearly four times the web average. Iran follows with 1.73% and Finland with 1.11%. In the United States the share is 0.79%, and in Germany, the Netherlands, Hong Kong and the United Kingdom it is 0.34% or lower.
For anyone segmenting the list by country, the server country is a hosting signal first. The domain extension, covered next, often says more about the market a site is built for.
Next.js by domain extension
49.7% of Next.js sites use a .com domain, 980,029 sites. The rest is spread across a mix that looks very different from the web as a whole.
| TLD | Next.js sites | Share of Next.js sites | Next.js share of all websites on the TLD |
|---|---|---|---|
| .com | 980,029 | 49.7% | 0.65% |
| .app | 68,276 | 3.5% | 3.39% |
| .org | 47,673 | 2.4% | 0.43% |
| .br | 44,804 | 2.3% | 1.36% |
| .net | 36,957 | 1.9% | 0.35% |
| .in | 36,223 | 1.8% | 1.42% |
| .ai | 31,637 | 1.6% | 3.00% |
| .uk | 27,718 | 1.4% | 0.33% |
| .de | 26,648 | 1.4% | 0.17% |
| .io | 24,884 | 1.3% | 1.76% |
| .dev | 21,078 | 1.1% | 2.17% |
.app is the second largest extension for Next.js, ahead of .org and .net. 3.39% of all .app websites run Next.js, more than five times the 0.61% web average.
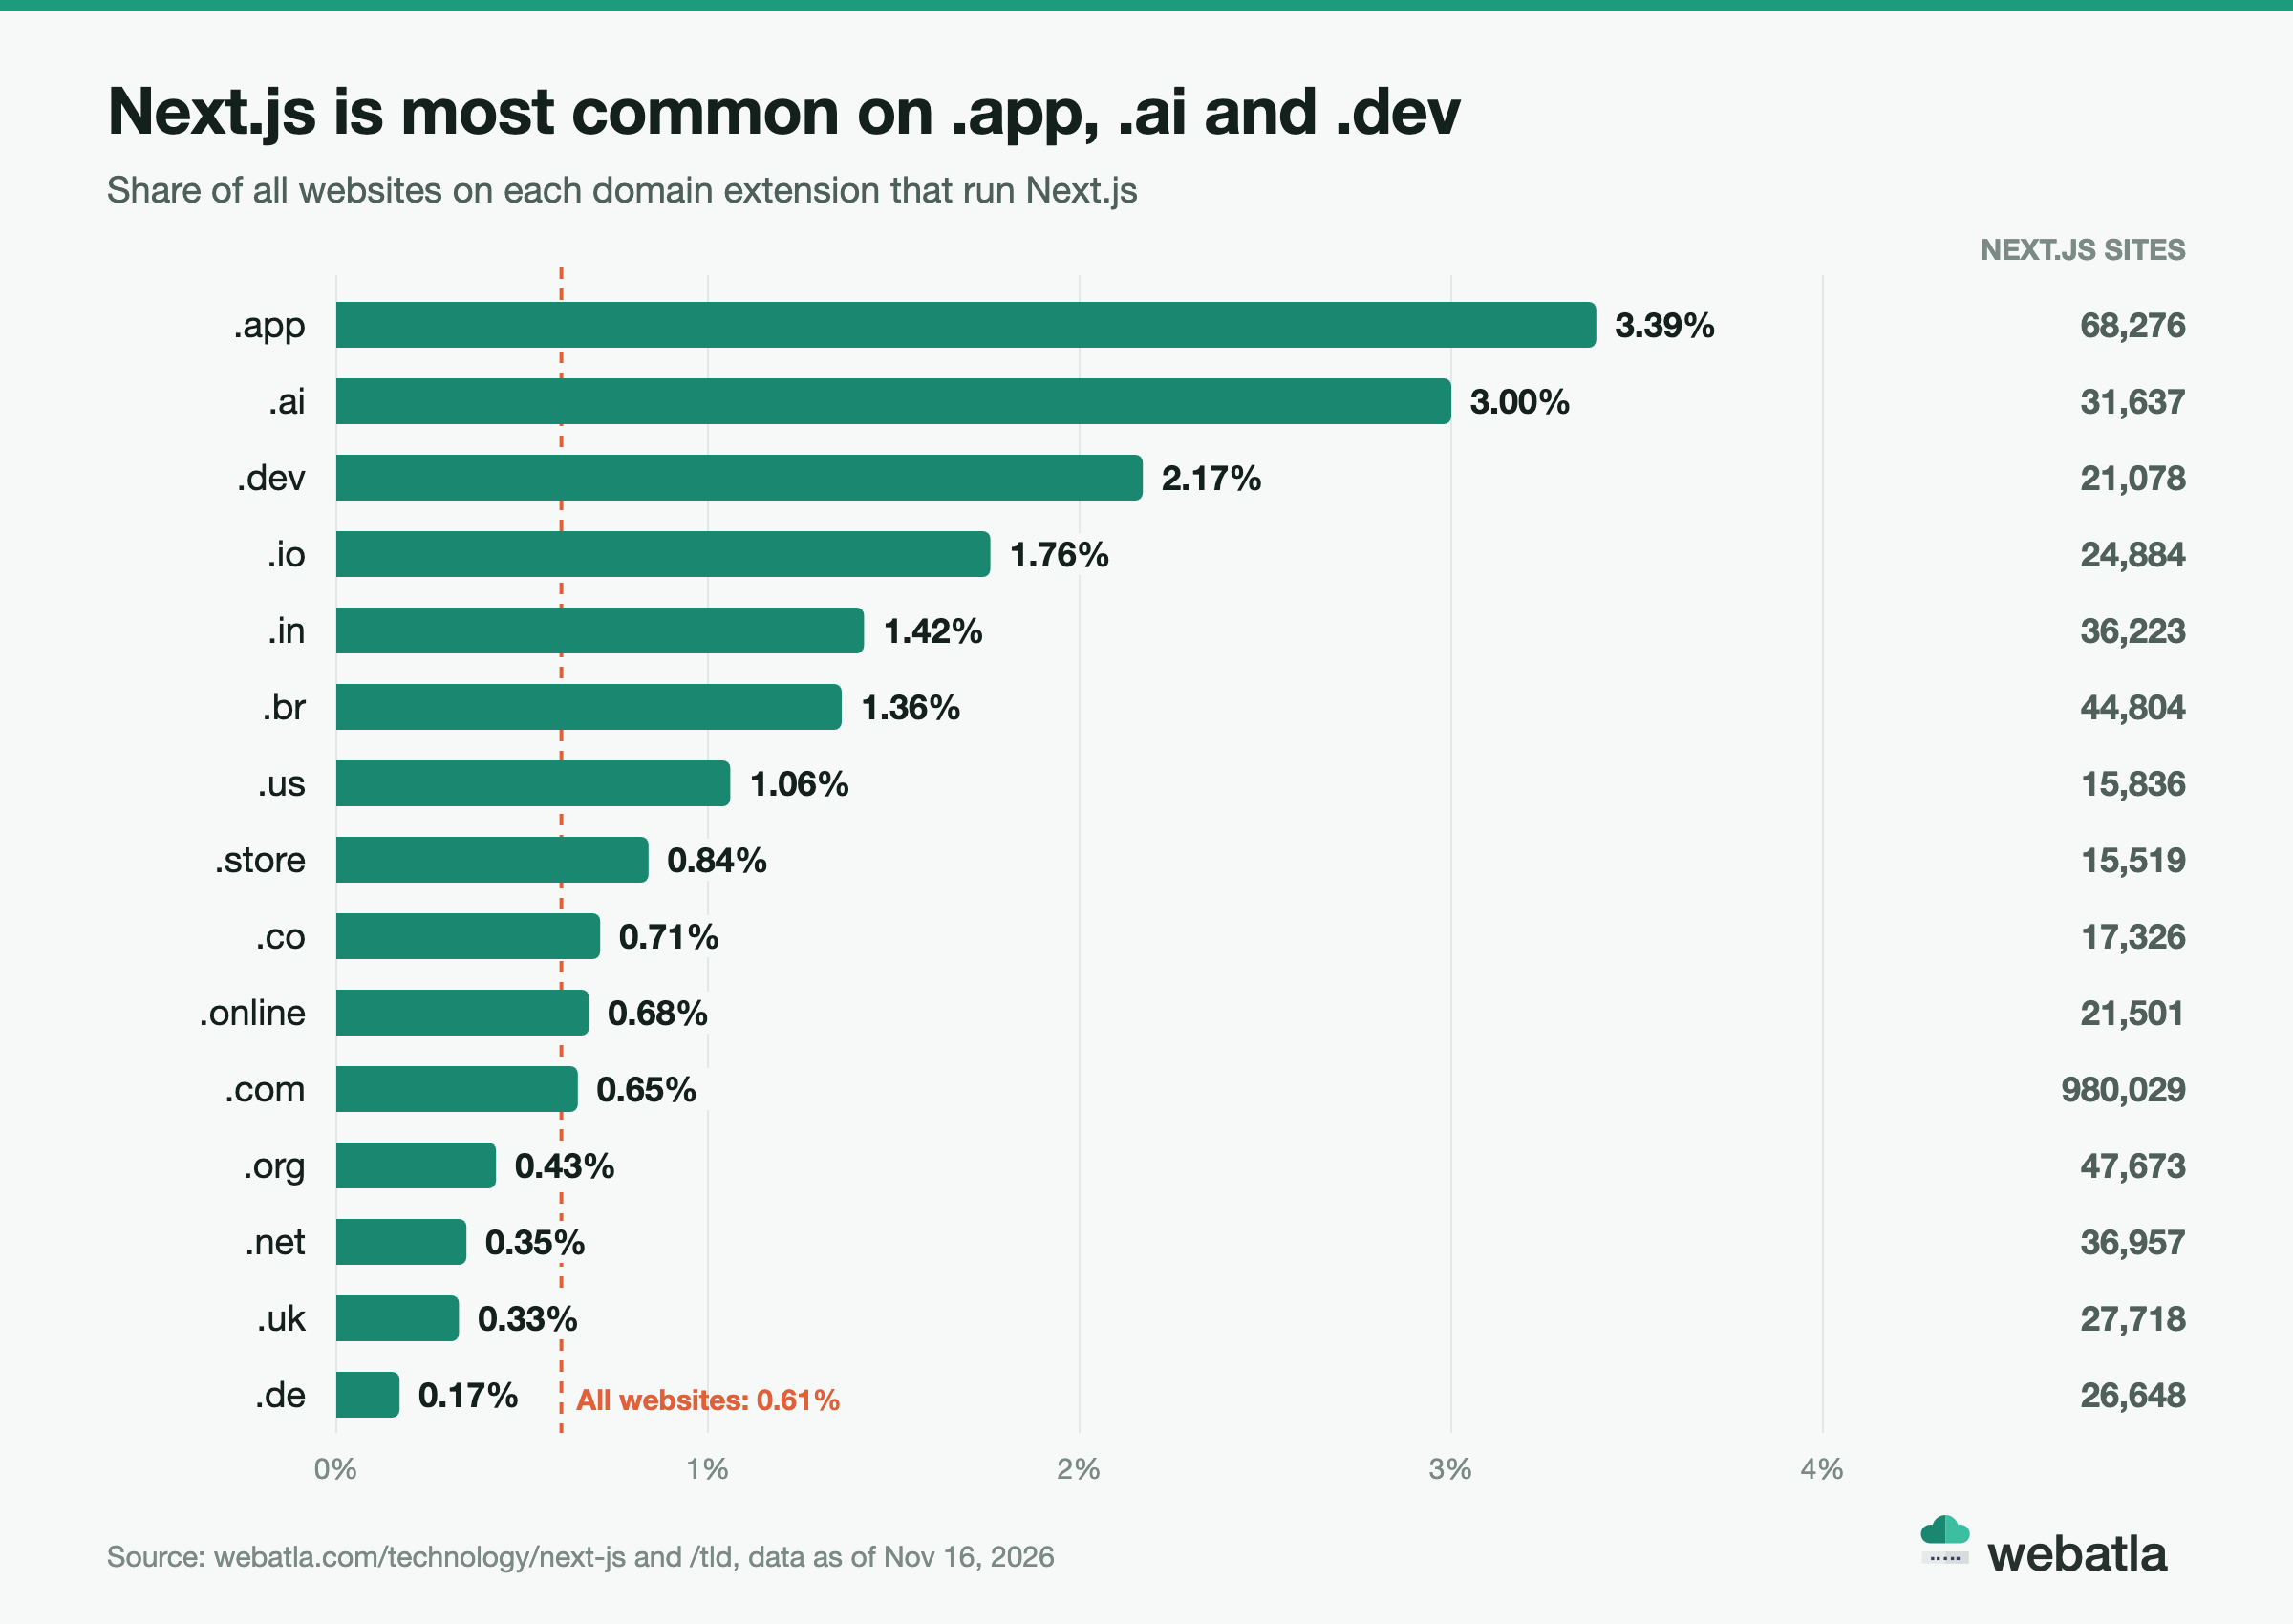
The pattern is clear. Next.js is most common on the extensions that product and developer teams choose: .app, .ai with 3.00%, .dev with 2.17% and .io with 1.76%. These are newer, more technical extensions, and the Vercel page notes the same lean for its own sites. On older country extensions such as .de and .uk the share is a quarter to half of the average.
India shows up twice. The .in extension has a 1.42% Next.js share, and India leads the country table by local share too. Brazil's .br is also above average at 1.36%.
One row needs care. On .cv, 11,326 of the 19,677 websites run Next.js, 57.6%. A concentration like that most likely points to one platform publishing many sites on the same extension, so treat it as a single cluster rather than a market.
What these Next.js usage statistics mean for business
A count of 1.97 million is a headline. The value is in the segments inside it, and each group of companies that sells to Next.js teams looks for a different one.
Developer tooling vendors want teams with a build pipeline. The Next.js technology page calls the framework a budget and headcount signal: a site built this way has front-end engineers and a deployment process. Monitoring, authentication, headless CMS, search and testing tools all sell to exactly this group, and 1,973,502 sites is a large, qualified starting list.
Hosting and edge platforms follow the moves. 876,000 sites switched to Next.js in the last 12 months, about 2,400 a day. A switch usually means a rebuild, and a rebuild is when hosting gets chosen again. Comparing today's file with yesterday's shows each new arrival.
Agencies look for rebuild work. Gatsby still runs on 74,110 sites and lost 23,600 in a year. AngularJS runs on 176,523 and lost 48% in three years. Those sites are the likely rebuilds of the next years, and the Next.js list shows what finished rebuilds look like: which hosting, analytics and content tools sit next to the framework.
Third-party script vendors need a compatibility map. Consent tools, chat widgets and testing platforms behave differently on server-rendered pages, so a vendor with a Next.js integration wants to know which of its prospects run Next.js.
Recruiters and market researchers use the geography. India has the highest Next.js share of local websites among the top countries, and .app and .ai sites are about five times more likely than average to run it.
Analysts and investors follow the flows. About 4,740 sites a day came to Next.js over the last year, and the switch from older frameworks only shows up when you compare the full list over time.
All of these questions are filters over the same full list. You run them on your own copy of the data, as narrow as you need, and you can keep yesterday's file to see what changed.
How webatla counts Next.js sites
A few notes on method, so you can read the numbers correctly.
- The count. 1,973,502 is every website where Next.js was detected in today's file, whatever its HTTP status. The file is rebuilt every day, and each row is one domain.
- The base. "Websites" means the 325,803,430 domains that answer with a web server. Market share against all websites uses this base.
- The peer group. Market share among site frameworks uses the 3,485,397 sites on the 20 technologies webatla files under Static site generator. A site that runs two of them counts twice in that base.
- History. Yearly and monthly figures come from webatla's monthly history of active sites, anchored to the webatla census of October 2026. The history reads archived page code. For Next.js it starts in August 2018, two years after the first release in 2016, so the earliest adopters are not in the series. Some months before 2025 are estimates between two measured months. October 2023 is one of them for every technology, so every three-year change in this article starts from an estimate. For Next.js the measured months on either side, September and November 2023, give a three-year multiple between 5.2 and 5.8, close to the +448% the page states. From November 2026 the counting model changed, so compare months with months and today's file with today's file.
- Versions. Shares are of the roughly 750 Next.js sites that expose a version.
- Countries. The country is where the server is, by IP address. Shares of Next.js sites are of sites with a known country.
- Domain extensions. The share of a TLD is the number of Next.js sites on it divided by all websites on that TLD.
Sites can hide or rewrite the signals used to detect Next.js, and a small share do. The numbers describe what is observable on the web, measured the same way every day.
Frequently asked questions about Next.js statistics
How many websites use Next.js?
1,973,502 websites use Next.js as of November 16, 2026, according to the webatla index. The count is refreshed every day on the Next.js technology page.
What percentage of websites use Next.js?
0.61% of all 325.8 million websites run Next.js, about one in 165. On .app and .ai domains the share is 3.39% and 3.00%.
What is the Next.js market share in 2026?
Next.js holds 56.6% of the market for site frameworks and static site generators in November 2026. Nuxt.js follows with 18.2%, Astro with 14.0% and Hugo with 5.3%.
Is Next.js growing in 2026?
Yes, fast. It changed by +448% from October 2023 to October 2026 and by +117% in the last 12 months. From January to October 2026 it gained a net 965,000 sites, more than in the three previous years combined.
How many new Next.js sites are created every day?
About 2,345. In the last 12 months 856,000 new sites started on Next.js. Counting sites that switched to it as well, about 4,740 sites join Next.js every day.
Is Next.js more popular than Vue.js and Nuxt.js?
Next.js has 3.1 times as many sites as Nuxt.js. Vue.js is still slightly ahead, with 2,061,594 sites against 1,973,502, but in the first ten months of 2026 Next.js added about 15 times as many sites as Vue.js.
How many React sites use Next.js?
The Next.js count is equal to 17.9% of the 11,053,868 websites that run React, about one in 5.6. In October 2023 the ratio was 4.4%.
Which country has the most Next.js websites?
The United States, with 1,483,166 Next.js sites hosted there, 76.9% of sites with a known country. Germany is second with 117,415. India has the highest share of local websites, 2.32%.
Which Next.js version is most used?
Only about 750 Next.js sites expose a version, so there is no reliable answer. Among those, 7.0.2 is the most common exact version, on 139 sites.
Get the full list of Next.js websites →
Every number in this article comes from one file. The webatla Next.js list holds all 1,973,502 websites running Next.js, one row per site, and it is rebuilt every day.
Each row gives you the domain, the full technology stack with versions, the IP address, hosting country, HTTP status, social profiles, PageRank and Harmonic rank, and the domain's creation and expiry dates. That means you can go far past the headline count:
- every Next.js site on .ai, .app, .dev or .io,
- every Next.js site hosted in India, Germany or any other country,
- every Next.js site that also runs Vercel, Netlify or a given analytics tool,
- every site that switched to Next.js since yesterday's file.
The Next.js list comes with the Technologies dataset for €159 a month: 313,947,451 websites, 3,000+ technologies, and ready files by technology, country and TLD. You can also download a free 20-row preview to see the format.