A +4,851% growth number can be perfectly accurate and still tell you almost nothing. Here are the fastest growing TLDs of Q1 2026, ranked by quarter-over-quarter growth, alongside the one question that actually matters: which of these spikes is a real trend, and which is a registry promotion dressed up as demand. I ran the query on webatla's own registration data. Below is the full ranking, the method, and a teardown of how to tell signal from noise.
The headline number first: across the top 50 TLDs in this query, new registrations went from 414,056 in Q4 2025 to 1,109,663 in Q1 2026 — a combined +168% quarter-over-quarter. That is a genuinely large move. But "combined" hides almost everything interesting, because the top of the percentage ranking is dominated by extensions growing from a base so small that the percentage is nearly meaningless.
The fastest-growing TLDs of Q1 2026
Here are the top 15 domain extensions by QoQ growth. Read the "Q4 base" column as carefully as the percentage — it's where the story is.
| TLD | QoQ growth | Q1 2026 | Q4 2025 base | Net adds |
|---|---|---|---|---|
| .makeup | +4,851.84% | 114,338 | 2,309 | +112,029 |
| .garden | +1,678.23% | 27,776 | 1,562 | +26,214 |
| .lol | +579.05% | 295,727 | 43,550 | +252,177 |
| .mobile | +463.70% | 3,478 | 617 | +2,861 |
| .boutique | +401.39% | 5,786 | 1,154 | +4,632 |
| .fyi | +325.79% | 11,292 | 2,652 | +8,640 |
| .delivery | +238.01% | 3,664 | 1,084 | +2,580 |
| .ooo | +228.18% | 2,294 | 699 | +1,595 |
| .immo | +227.73% | 2,458 | 750 | +1,708 |
| .beauty | +217.52% | 30,155 | 9,497 | +20,658 |
| .cv | +202.37% | 5,621 | 1,859 | +3,762 |
| .best | +190.25% | 9,050 | 3,118 | +5,932 |
| .food | +182.19% | 7,718 | 2,735 | +4,983 |
| .date | +135.91% | 1,281 | 543 | +738 |
| .link | +133.28% | 47,324 | 20,286 | +27,038 |
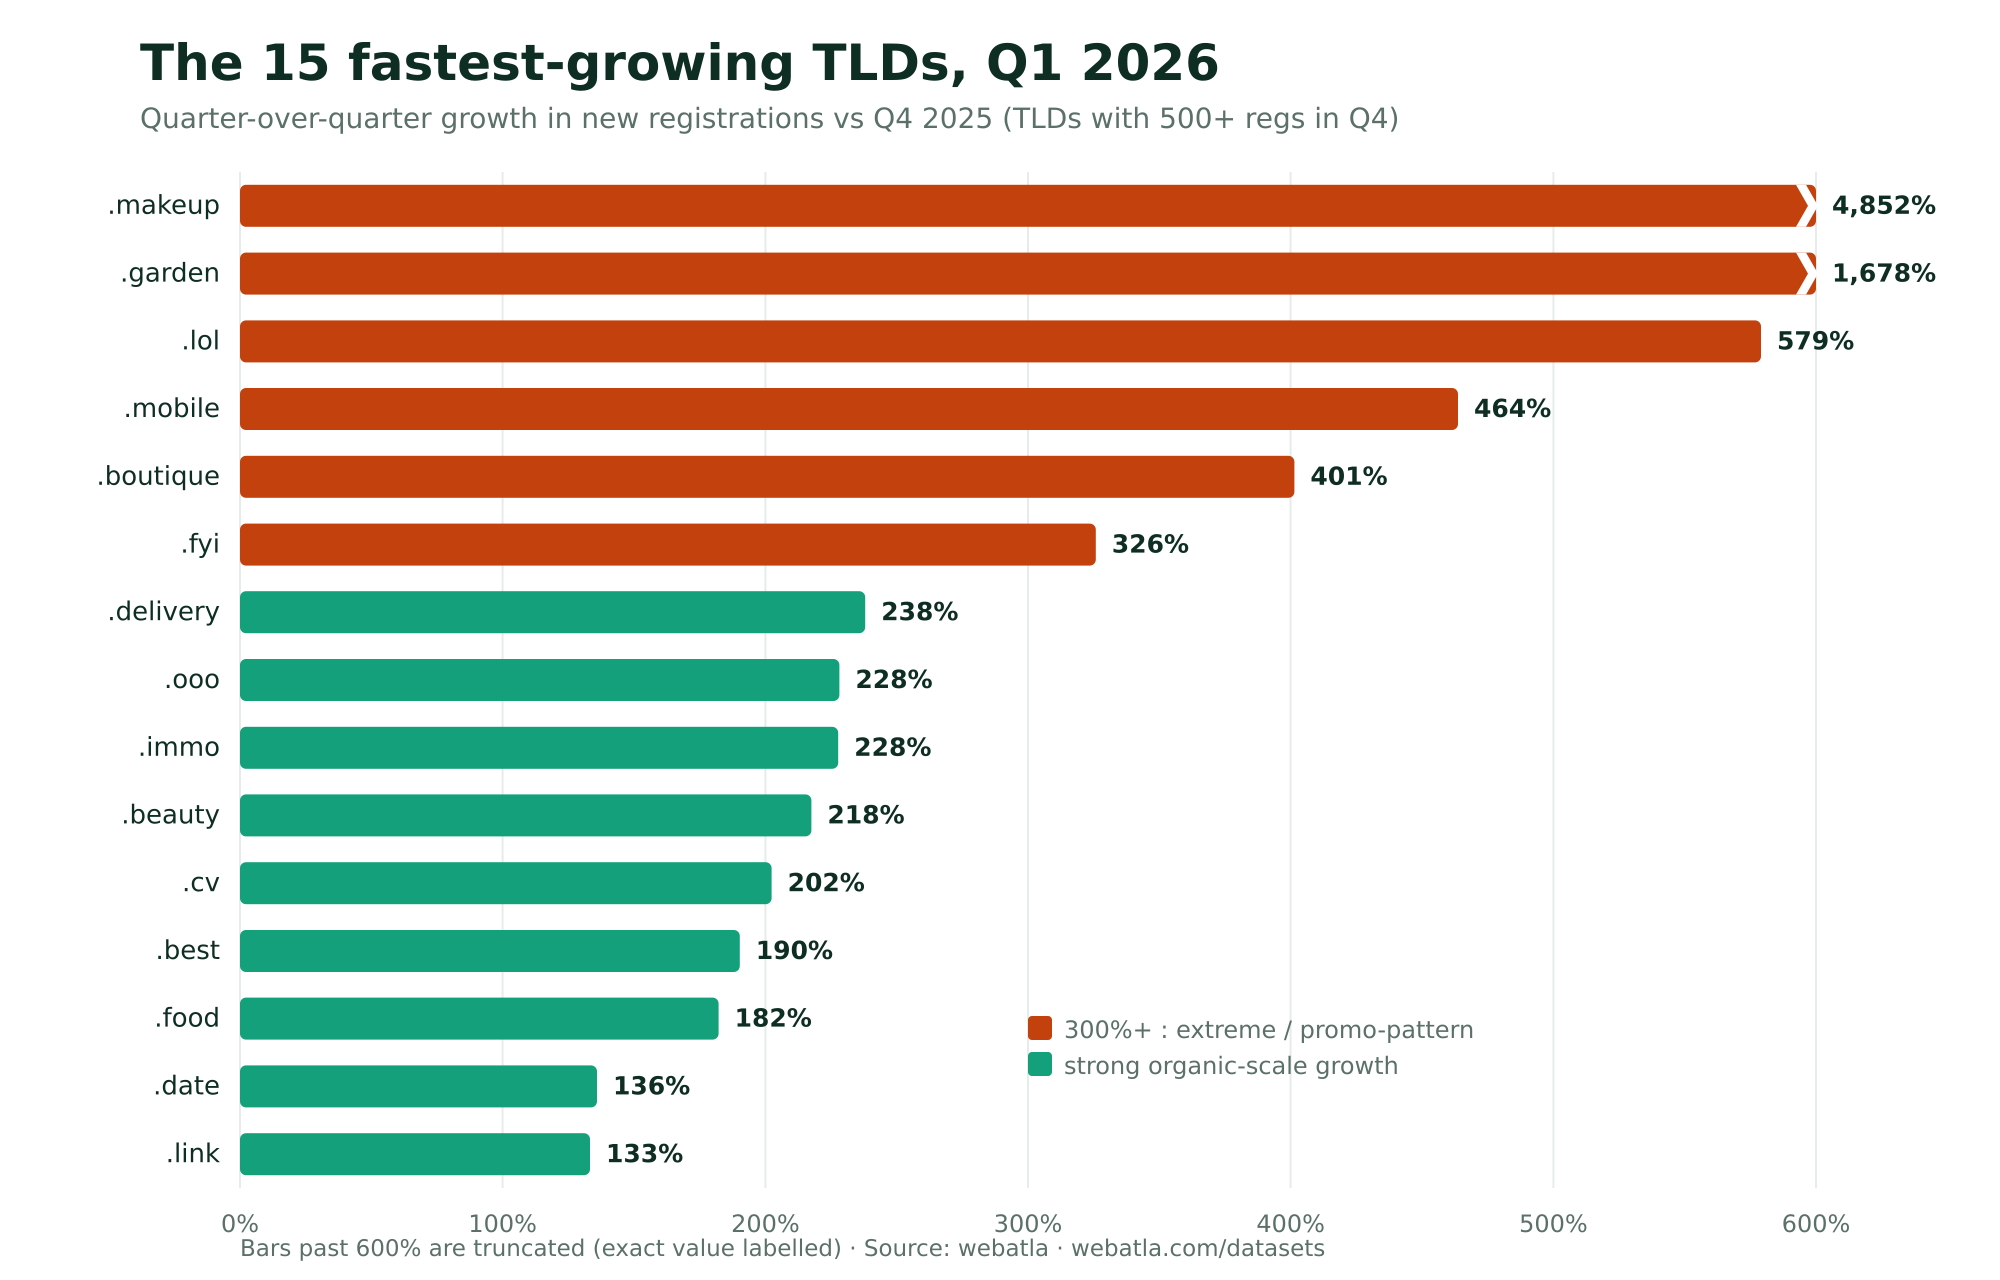
.makeup tops the list at +4,851%. That is not a typo, and it is also not a market signal. It went from 2,309 registrations in Q4 to 114,338 in Q1 — a 49x jump from a base of barely two thousand domains. That is what a bulk or promotional registration event looks like, not what a new wave of beauty brands discovering the web looks like. .mobile (+463% from a base of 617) is the purest version of the trap: tiny base, big multiplier, and a genuinely small gain of just +2,861 domains. .garden is trickier — +1,678% and +26,214 net adds — a number that's big and fast, which we'll stress-test below.
The trap is treating the percentage column as a ranking of demand. It isn't. It's mostly a ranking of how small last quarter was.
Where the volume actually went
If you want to know which extensions real registrants are actually choosing, sort by net adds — Q1 minus Q4 — not by percentage. The ranking reshuffles completely.
| TLD | Net adds | QoQ growth | Q1 2026 volume |
|---|---|---|---|
| .lol | +252,177 | +579.05% | 295,727 |
| .makeup | +112,029 | +4,851.84% | 114,338 |
| .asia | +85,580 | +78.68% | 194,345 |
| .life | +32,892 | +62.26% | 85,719 |
| .link | +27,038 | +133.28% | 47,324 |
| .tech | +26,487 | +50.29% | 79,160 |
| .garden | +26,214 | +1,678.23% | 27,776 |
| .beauty | +20,658 | +217.52% | 30,155 |
| .one | +19,048 | +83.45% | 41,875 |
| .studio | +9,613 | +53.26% | 27,662 |
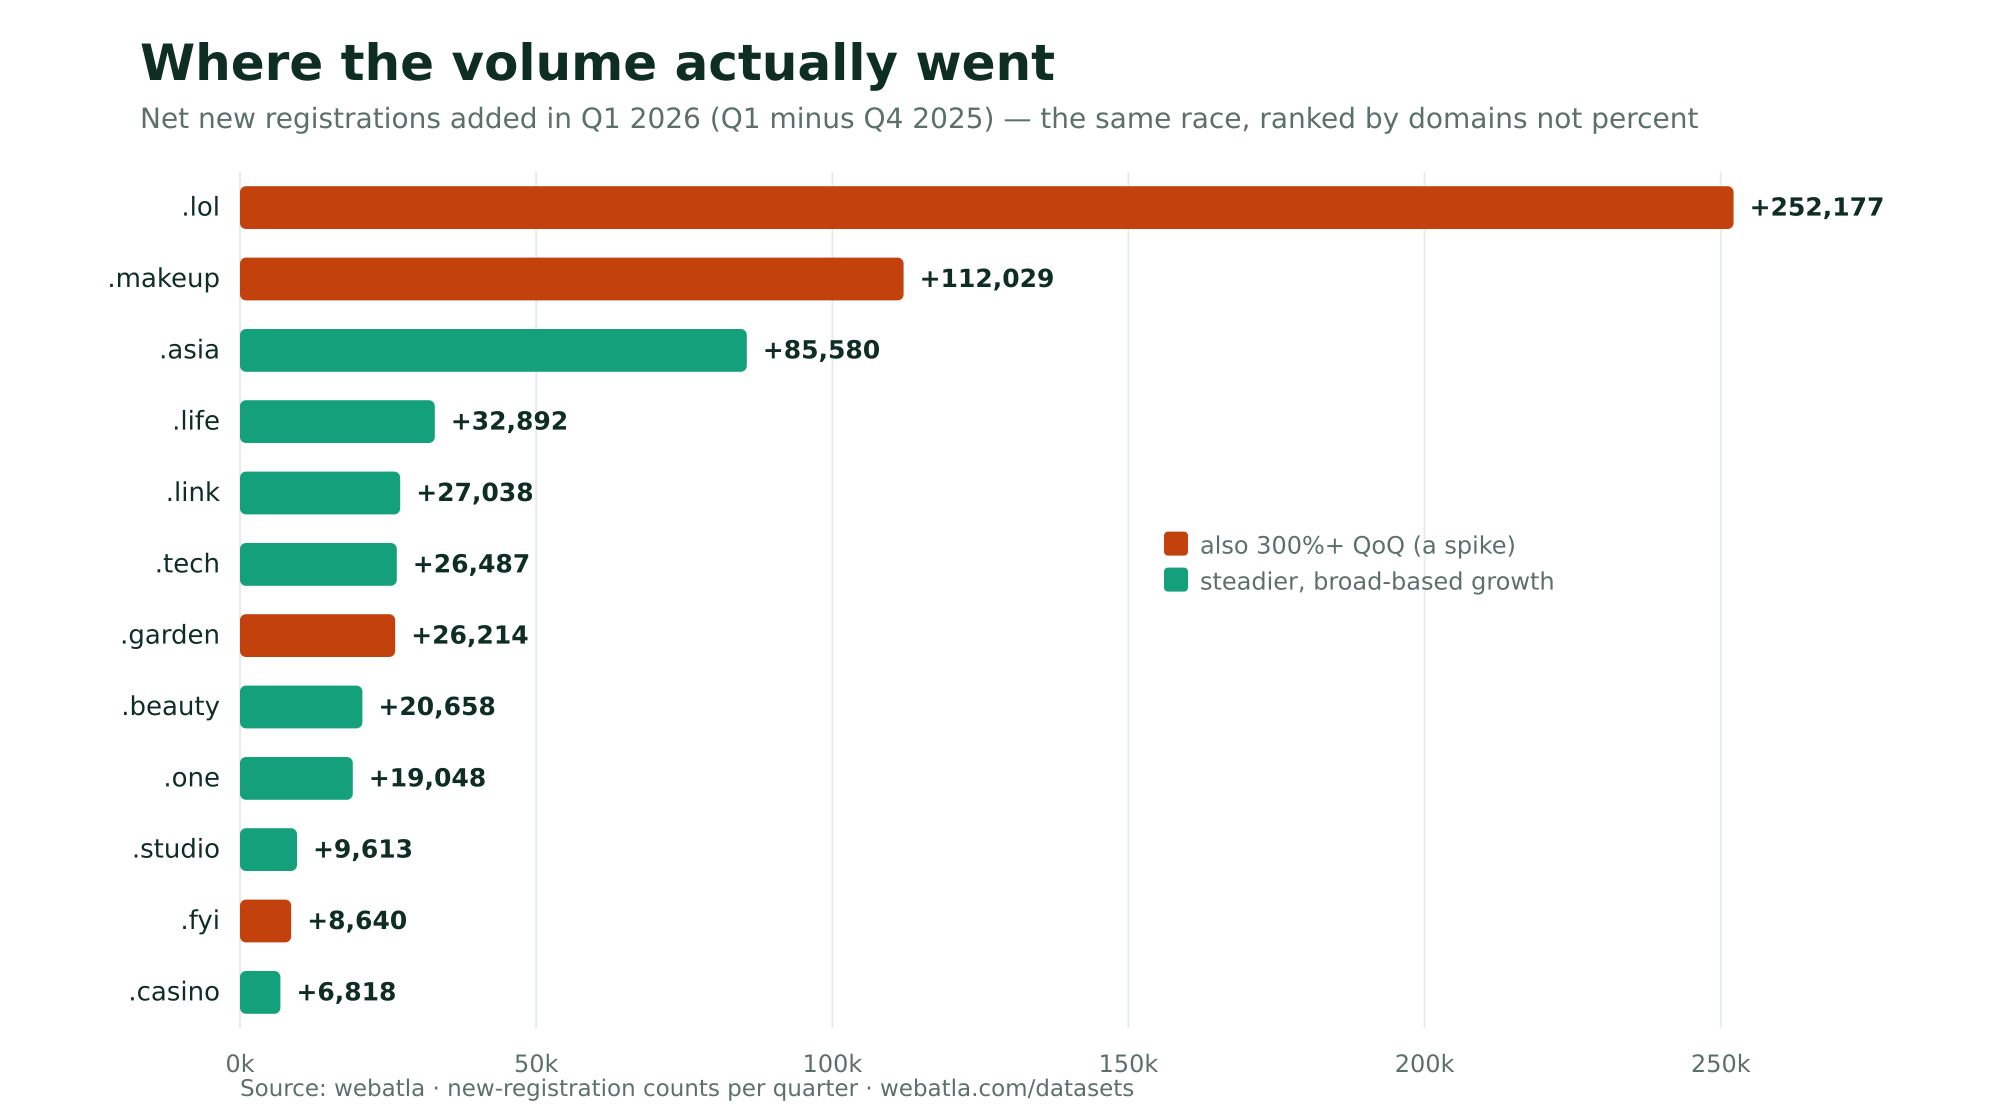
Look at .asia: +85,580 net adds, but only +78.68% QoQ. It never appears on the percentage leaderboard, yet it added more real domains than every TLD except .lol and .makeup. .life (+32,892, +62%), .tech (+26,487, +50%) and .one (+19,048, +83%) tell the same story — moderate, double-digit-percentage growth on top of an already-large base. That is what sustained adoption looks like. It's quiet. It never makes a "fastest-growing" headline because the percentage isn't flashy, but it moves far more domains.
These are the new gTLD registration trends worth tracking in 2026: not the 4,000% spikes, but the extensions adding tens of thousands of domains a quarter at a steady clip. By Q1 2026 absolute volume, the leaders are .lol (295,727), .asia (194,345), .makeup (114,338), .life (85,719) and .tech (79,160).
Signal vs noise: how to tell a real trend from a registry promotion
Here is the single most useful chart in this post. Plot every TLD with growth rate on one axis and Q1 volume on the other, and the bubbles sort themselves into three groups.
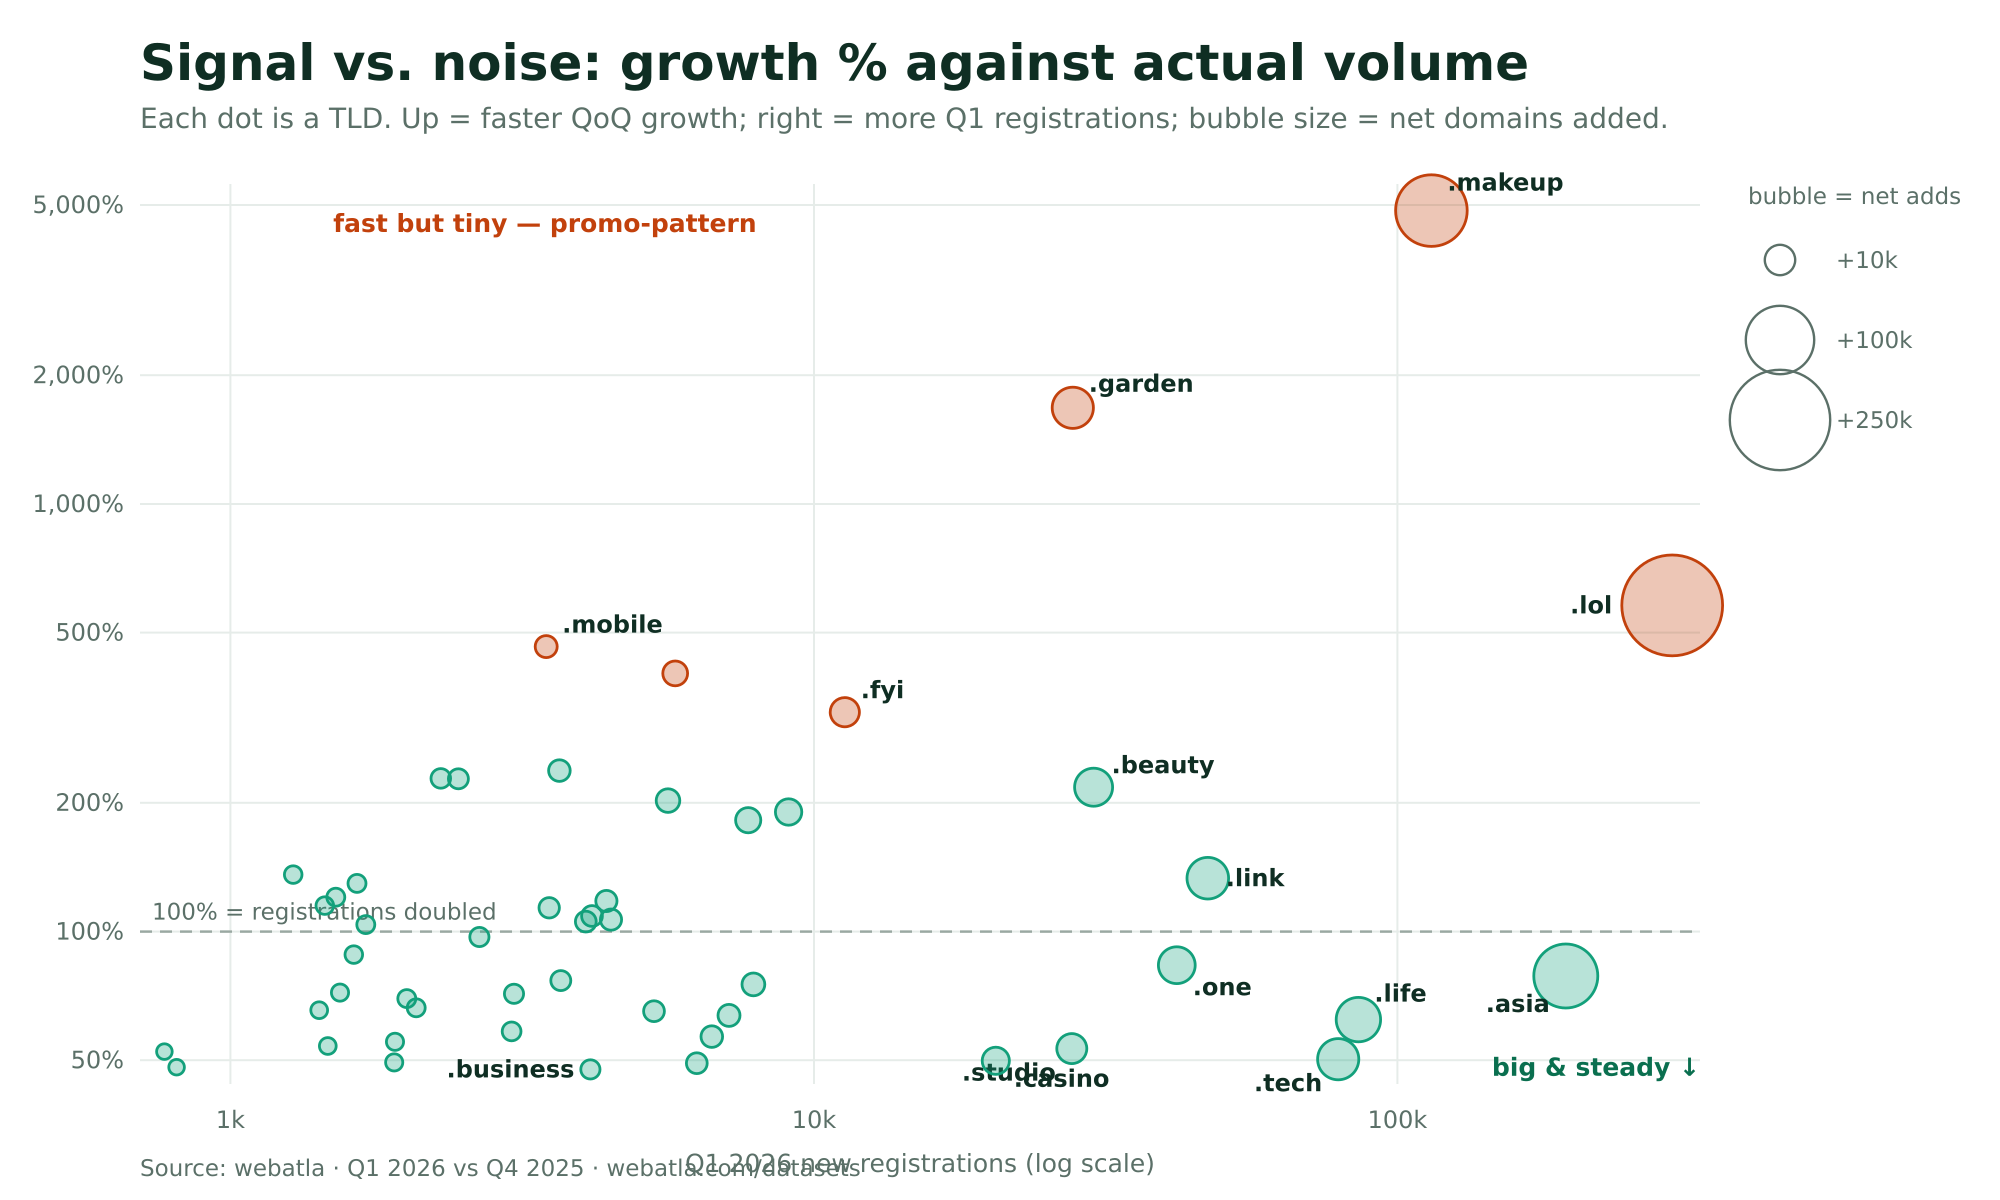
- Huge % from a tiny base (mostly noise): .mobile, .boutique, and the long tail below them (.delivery, .ooo, .immo, .date). Small Q4 bases, modest absolute gains — the percentage is almost pure arithmetic.
- Promotion-driven volume (real domains, unproven trend): .makeup, .garden, .beauty — and much of .lol. These genuinely added domains in bulk (.makeup +112,029, the second-biggest gain of any TLD; .garden +26,214), so they are not "small volume." But the driver is pricing, not adoption — so watch renewals before calling any of them a trend.
- Genuine sustained growth (signal): .asia, .life, .tech, .one, .link. Moderate double-digit growth on already-large bases — quiet, durable, and nowhere near the top of the percentage leaderboard.
.lol is the one extension that leads on both axes — the biggest absolute gainer (+252,177) and +579% — which would be the dream signal if the volume were clean. As the teardown below shows, it isn't.
The .makeup teardown
.makeup is the clearest case study of why high percentage alone is a trap. It entered the quarter on a Q4 base of just 2,309 registrations — a small TLD (around 166,000 domains in total), operated by XYZ.COM LLC on the CentralNic back-end. That tiny base is the precondition: a large absolute add turns into a stratospheric percentage by arithmetic alone.
Then there's a confirmed catalyst. XYZ Registry raised wholesale prices on .makeup, .beauty, .lol and thirteen other XYZ extensions effective 26 August 2025. Registrars responded exactly as you'd expect — Porkbun and others explicitly told customers to register or renew for up to ten years before the deadline to lock in cheap pricing. When a roughly $1.80 first-year price faces a jump to ~$13, you get a pull-forward: registrations that would have trickled in over years get compressed into a few months. That's a price event, not a demand event.
The same mechanism explains .beauty (+217% off a Q4 base of 9,497, same XYZ registry, same August price hike) and is a major factor in .lol — which carries the additional hallmarks of cheap bulk registration: a ~$0.99–$1.21 first year against a ~$25+ renewal, very high churn, and a documented abuse/spam reputation. So even .lol, the one TLD that's high on both axes, isn't unambiguous organic demand. A large chunk is cheap, speculative, high-churn registration that may not renew. High on both is better than high on percentage alone — but you still have to check whether it sticks.
For the rest — .garden (GoDaddy Registry), .mobile (Dish DBS, a near-dormant ~5K namespace where any bulk add explodes the percentage), .boutique and .fyi (both Identity Digital; .fyi is ~37% concentrated in a single registrar channel, the textbook fingerprint of a reseller or promo wave) — I found no single named promotion. But the pattern is unmistakable: small or dormant base, cheap first-year pricing, single-channel concentration. That combination is the signature of a promotion or speculative bulk registration, not proof of organic end-user demand.
"Registration velocity is a leading indicator — it tells you where capital and attention are moving a quarter or two before the market notices. But velocity has to be read correctly. A 4,000% spike from a registry price event and a steady 60% climb on a base of 80,000 domains are opposite signals wearing the same 'growth' label. The skill is telling them apart, and that's a data problem, not a marketing one." — Alan, CEO, webatla
This is the same lesson from our earlier teardown of the .ai boom: the durable trends are the ones still growing after the promo pricing ends. Velocity is the leading indicator; renewal is the confirmation.
Methodology: how we measure TLD growth
The method is deliberately simple. Take every domain's registration date, bucket it into quarters — Q1 2026 is January to March, Q4 2025 is October to December — group by TLD, and compare the two counts. QoQ growth is just the percentage change between them. The only fields it needs are each domain's TLD and its created registration date, so anything that can read the dataset's JSONL export reproduces it.
The decision that matters most is the minimum-base floor: I only counted TLDs with at least 500 registrations in the Q4 baseline. Without that floor, the leaderboard fills with micro-TLDs where five registrations becoming fifty reads as a "900% surge" that means nothing. Even with the floor, .makeup still posts +4,851% — which tells you how aggressively you have to read the base column. To harden it further, add a net-adds floor and rank by absolute gain, exactly as in the second table above.
A caveat I'd apply to my own numbers: these are creation-date counts from registry data, so they capture registrations, not surviving, renewed, in-use domains. For promo-driven TLDs especially, a chunk of Q1's spike won't be there in a year. That's the difference between velocity and durability — and it's why the net-adds view and the renewal follow-up matter more than the percentage headline.
FAQ
What was the fastest growing TLD in Q1 2026? By QoQ percentage, .makeup at +4,851.84% (2,309 → 114,338). But by net new registrations, .lol led with +252,177 added domains. The two questions have different answers, which is the whole point — percentage and volume are not the same ranking.
Is .makeup growth real? It's a real spike in registrations, but it's almost certainly promotion- and price-driven, not organic end-user demand. .makeup grew from a tiny ~2,300-domain base, and its registry (XYZ.COM LLC) raised wholesale prices in August 2025, which pulled forward cheap registrations and renewals. Treat it as a price event, and watch the renewal rate before calling it a trend.
How do you measure TLD growth and QoQ domain registration growth?
Count new registrations by their created date in each quarter, then compare. We bucket Q1 2026 (Jan–Mar) against Q4 2025 (Oct–Dec) and compute the percentage change, with a minimum-base floor so tiny TLDs don't produce meaningless percentages. Always read net adds alongside the percentage — they answer different questions.
Which fastest-growing domain extensions are genuine trends versus promotions? The genuine ones grow at moderate percentages on large bases: .asia, .life, .tech, .one, .link. The promo-pattern ones show huge percentages from tiny bases: .makeup, .garden, .mobile. .lol is the rare extension that's high on both, though much of its volume is cheap, high-churn registration. Browse any extension in the full TLD directory.
Get the data
Everything above came from one pass over one file. The fields it needs — each domain's TLD and its created registration date — live in any webatla dataset that carries registration dates, and the analysis is only as fresh as your data.
- Domain Investor dataset → — €299, built around fresh registrations, with
tldandcreatedon every domain. The on-theme tool if your job is spotting which TLDs are heating up — pull a fresh export each quarter and you catch the next spike first. - Websites + Ranking → — €99, also carries
createdandtld(plus a popularity rank), if you want the same time-series at a lower entry price. - All Data → — €599, the full field set (WHOIS/RDAP dates, DNS, tech stack, ranking) if you want to slice growth by registrar, host or technology too.
Browse the full dataset catalogue and pricing, or learn the basics first with our guide on how to download a list of all active domains. Then do exactly what I did: bucket by registration date, group by TLD, and read the base column before you call anything a trend.